Unmanned Aerial Vehicles in Municipality
Level 3D Topographic Data Production in Urban Areas
Olli NEVALAINEN, Tomi ROSNELL, Teemu HAKALA, Eija
HONKAVAARA, Roope NÄSI, Kimmo NURMINEN, Finland
    
Olli NEVALAINEN Tomi ROSNELL Teemu HAKALA
Eija HONKAVAARA Roope NÄSI
1)
This paper was presented at the FIG Working Week 2017 in Helsinki,
Finland, 29 May – 2 June. This paper describes general properties and
characteristics of different types of UAVs. Results showed that UAV
photogrammetry provides low cost tool for producing topographic data in
urban areas, especially when small areas are of concern.
SUMMARY
The National Land Survey of Finland (NLS) is currently working
towards a new joint National Topographic Database (NTDB). Large scale
municipality level urban 3D topographic data will have a great role in
the forthcoming NTDB. Potential of future topographic data production
methods, such as using unmanned aerial vehicles (UAV), to reduce manual
labor in the field and provide more cost-efficient map updating in urban
areas needs to be investigated.
This paper describes general properties and characteristics of
different types of UAVs, such as multirotors and fixed-wings and
presents a typical UAV system for mapping application including its
payload. Operating UAVs in populated urban areas requires proper
planning and work guidelines in order to produce accurate and reliable
data and simultaneously operating safely and taking into account the
local legislation regarding unmanned aviation. The preliminary process
flow for a UAV-based mapping which takes into account these issues will
be presented. The process starts from the measurement planning and end
up to 3D vectorized topographic data.
The paper presents results of a test case were the described
workflow has been used to produce 3D topographic data of urban area
using UAV imagery and photogrammetry. Results showed that UAV
photogrammetry provides low cost tool for producing topographic data in
urban areas, especially when small areas are of concern.
1. INTRODUCTION
The National Land Survey of Finland (NLS) is currently working
towards a new joint National Topographic Database (NTDB). The NTDB will
provide basic information about physical environment including objects
such as buildings, roads, waters, elevation, land cover and place names.
The data will be based on the current NLS Finland Topographic Database,
orthoimages, laser scanning data, digital elevation models and on large
scale planning data from municipalities. As large scale data from
municipalities will have a great role in the forthcoming NTDB, a project
has been started to investigate the current and future topographic data
production methods in Finnish municipalities in urban areas. The project
investigates what are the current topographic data production processes
and could new mapping methods, such as using unmanned aerial vehicles
(UAV) or terrestrial mobile mapping technologies, reduce manual labor in
the field and provide more cost-efficient map updating in urban areas.
The project investigates the usability of these methods and prepares a
preliminary process model and guidelines for using these methods in
municipality level 3D topographic data production. Furthermore, the
project includes several case studies in producing 3D topographic data
in different municipalities using UAVs.
This paper focuses on describing the UAV part of the project. General
properties and characteristics of different types of UAVs, such as
multirotors and fixed-wings will be described and a typical UAV system
for mapping application including its payload will be presented.
Usability of UAVs in mapping objects for municipality level topographic
database in urban areas and applicability of UAV-based mapping in
different situations will be evaluated.
Operating UAVs in populated urban areas requires proper planning and
work guidelines in order to produce accurate and reliable data and
simultaneously operating safely and taking into account the local
legislation regarding unmanned aviation. The preliminary process flow
for a UAV-based mapping which takes into account these issues will be
presented. The process starts from the measurement planning and end ups
to 3D vectorized topographic data. This process is divided to three
phases which are the planning phase, measurement phase and data
processing phase. These phases are described in more detail in this
paper.
2.METHODS
2.1General overview of UAV systems for mapping applications
2.1.1 UAV system
A basic UAV-system consists of the aircraft, pilot with a remote
control and ground control station. Typical sub-systems on-board a UAV
are an autopilot, a global navigation satellite system (GNSS) receive,
inertial measurement unit (IMU), power supply and transmitter for
telemetry information. UAV systems usually also include flight planning
software.
2.1.2 Types of UAVs
UAVs vary in size and operation principles. Two of the most used UAV
types are fixed-wings and rotary wings (e.g. multirotors and
helicopters). Fixed-wing UAVs operate using the lift caused by the
forward airspeed and aerodynamical rigid wing attached to the UAV. The
forward speed is usually created using propellers. The required forward
speed for take-off can be achieved using a runway or a launcher. The
fixed-wings require more landing space compared to rotary wings that can
be challenge in tight spaces in urban areas. Rotary wings use multiple
rotors whose rotation axis points upwards. The horizontal motion is
achieved by varying the relative speeds of the rotors. Constant airflow
and forward motion is not required and thus rotary wings can take-off
and land vertically. This is one of their notable benefit, especially in
urban environments were there might not be proper takeoff areas. The
flight velocity of fixed-wings is usually higher than with multirotors
and thus can provide more areal coverage. However, they are at the same
time unable to move as slow as rotary wings or move vertically which are
sometimes beneficial features in urban aerial imaging.
2.1.3 Payload
The usual payload for UAV in urban mapping application is a good RGB
compact or DSLR (digital single-lens reflex) camera. The geometrical and
radiometrical quality and accuracy of the end-products is directly
related to the geometric and radiometric properties of the camera
system. Small laser scanners are also becoming available for UAVs and
their use in the future will increase. Previously, the weight of the
laser scanner has limited their use in UAVs, especially in urban areas
which have more strict weight limits. More specialized cameras, such as
multi- or hyperspectral cameras or thermal cameras are also becoming
more common in UAVs due to sensor development.
2.1.4 Imaging configurations
The two basic imaging configurations for mapping purposes are nadir
and oblique imaging. The nadir imaging mode provides the view which
corresponds to the traditional manned aircraft aerial imaging mode
providing the imagery for orthoimage creation of the area of interest.
Oblique imaging is beneficial when the facets of buildings are of
importance, for example, when textures for 3D city model are of
interest. Imaging configuration can also be modified with different
kinds of flight patterns. The RPAS operation can be either based on
visual-line-of-sight (VLOS) or beyond-visual-line-of-sight (BVLOS).
2.2 Overview of UAV based mapping workflow
A process flow for
UAV-based mapping is divided to three phases which are the planning
phase, measurement phase and data processing phase. The sub-tasks in
each phase are:
- Planning phase: General planning and
measurement method decision based on the mapped area and required
accuracies; Legislative preparations; Risk management; and Flight
planning.
- Measurement phase: Ground Control generation; and
Aerial imaging.
- Data processing and mapping phase: Aerial image processing to
orthomosaics and 3D point cloud data; Accuracy evaluation; and
Vectorization of 3D data to topographic data format or other
map-updating tasks. These phases and their sub-tasks are described in
detail in the following sections.
2.3 Planning phase
2.3.1 General planning and measurement method decision
The
very first phase after the need for topographic map update has realized
is to consider and evaluate the proper measurement method for mapping
the area of interest (AOI). Examples of subjects that have an impact on
the decision are:
- geographical area
- required accuracy
for the topographic data
- accessibility
- topographic
profile
- restrictions affecting the area, such as closed or
restricted airspace or prohibition of aerial imaging
- type of targets in the area that require mapping
2.3.2 Legislative preparations and Risk management
If UAV-based aerial imaging is chosen as the mapping method,
necessary preparations demanded by the local legislation and
regulations, has to be taken into account. All the possible restriction
applying to the area of interest needs to be investigated and
considered.
For example, current Finnish regulations on UAV operation (Trafi,
2016) demand that proper safety and risk assessment has to be done when
operating at densely populated areas. All the possible risks have to be
identified and possible methods to eliminate or minimize the risks have
to be determined. In addition, the UAV operator’s organization has to
have up-to-date UAV operations manual which includes procedures
guidelines in normal operation and in case of problems.
2.3.3 Flight planning
The flight planning should be conducted in such a way that the
operation is safe and the objectives in data accuracy and reliability
can be achieved throughout the area of interest. Multiple flights have
to be planned if the AOI cannot be covered properly with one flight.
The timing of the flights is also important. The elevation angle of
the sun above the horizon is usually preferred to be as large as
possible in order to minimize the size and amount of shadows in the
imagery. UAV operation is also highly depended on the weather conditions
and the UAV system used. Some UAVs are more stable in windy conditions
than others and UAV operation during rain is hardly ever desirable.
Thus, weather forecasts should be followed when the planned flight day
is approaching and changes to the plans made if required.
The used camera system and flight altitude is chosen based on the
wanted ground sampling distance (GSD). Overlaps of adjacent images
affect the quality and accuracy of the orthomosaics and photogrammetric
point clouds, and thus the planned flights should provide proper side
and forward overlaps. The forward overlap is determined by the camera
field of view (FOV), imaging interval and flight velocity. The side
overlaps are determined by the camera FOV and spacing of the adjacent
flight paths. Take-off location should planned so that pilot can see the
UAV during the entire flight and pilot’s field of view covers as much of
the surrounding airspace as possible.
Ground control points (GCPs) are used to georeference the imagery to
a real world coordinate system. The GCPs can also be used to evaluate
the resulting geometric accuracy of the end-products. The GCPs should be
distributed evenly to the AOI.
If the AOI is imaged with several flights, some of the GCPs should be
placed so that they are imaged from different flights. Enough GCPs
should be placed on the AOI to enable required accuracy for
georeferencing. The amount of GCPs needed is also affected by the
accuracy of the on-board navigation system. In addition to the GCPs,
additional check points can be planned to the AOI. These check points
are only used to evaluate the accuracy of the processed data.
The positons of the GCPs and check points should be planned as well
as possible but the final decision of the exact position is done in the
field, since the visibility of the GCP targets can be determined most
reliably in situ. GCPs can be natural targets, such as road markings, or
special geometric tags.
2.4 Measurement phase
2.4.1 Ground control generation
The locations of the GCPs and check points are placed on the AOI as
planned and they are measured using proper accurate terrestrial
measurements system, such as an accurate GNSS receiver or a total
station. The georeferenced accuracy of the end products can be only as
good as the ground reference measurements.
2.4.2 Aerial Imaging
The location of the take-off place
should be chosen so that a safe take-off and landing can be performed.
In addition, the take-off spot should allow the pilot to move freely and
see the UAV during whole flight. Assistance for observing the
surrounding airspace can be provided by other personnel. If the
weather conditions permit and nothing is preventing safe operation, the
flights should be performed as planned. The functioning and behavior of
the UAV should be monitored visually and by monitoring the telemetry
data received from the UAV. If severe problems are encountered, the
flight should be aborted as the user’s UAV operations manual states.
After the flights have been successfully performed and the UAV has been
safely landed, the image data should be briefly checked in order to be
sure that the camera was functioning properly and images are visually
acceptable in sharpness and contrast (i.e. geometrically and
radiometrically).
2.5 Data processing phase
2.5.1 Aerial image processing
UAV-based aerial images are
processed using photogrammetric software that are able to produce 3D
data from multiple 2d images. Methods, such as multiview stereo
photogrammetry, structure-from-motion and dense image matching are used.
The software are usually quite automatic and human operation and
decision is mainly required in inputting the data, selecting the
processing parameters and indicating the GCPs from the images. The basic
outputs of the photogrammetric processing are:
- Orthomosaics
- RGB point clouds
- Geometric accuracy report
- Camera calibration parameters
- Digital surface model (DSM)
- Mesh (i.e. triangulated model of the point cloud)
2.5.2 Accuracy evaluation
The photogrammetric software for
producing topographic data should have reporting capabilities that will
output accuracy evaluation based on the internal and external camera
calibration parameters and GCPs.
2.5.3 Vectorization of data to topographic data format
The number of commercial software that can automatically produce
topographic data in vector format from point cloud data has been quite
limited. However, the increased usage of laser scanners and
photogrammetric methods to produce 3D data has promoted the development
also in the software side. However, automatic methods for point cloud
vectorization currently mostly limited to buildings which are of the top
interest in urban areas. The amount of automated procedures for
vectorization of other types of targets than buildings, are surely
increasing in the future.
3. Results & Discussion
3.1 Test case Vihti-Nummela
3.1.1 Planning
Vihti municipality did not have and urgent
update need for any of their urban areas since their topographic data
was well up-to-date on the urban areas. However, the Nummela center area
in Vihti did have needs for future planning and we chose it as our AOI (
Figure 1).
According to the Finnish UAV
regulations, Nummela center is a densely populated area which requires
extra caution and risk assessments for measurement planning. As the area
is densely populated the operation had to be based on visual line of
sight (VLOS), and detailed risk assessment report had to be produced.
There was also a small airfield west from Nummela center which is mainly
used by hobbyists and private persons. The airfield does not have own
continuous air traffic control or official control zone (CTR) zone.
However, communication between the airfield operators was required and a
notice to airmen (NOTAM) was created for the duration of our
measurements.
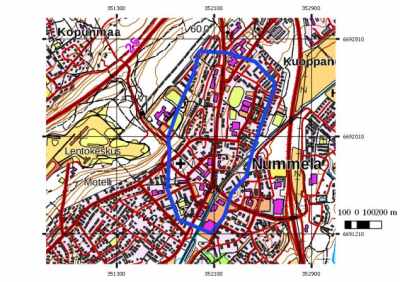
Figure 1 Project Area of interest
(AOI): Nummela center in Vihti municipality in southern Finland.
The
flight planning was done using open source software MissionPlanner
(ArduPilot Development Team). The area of interest was approximately 49
ha. In order, to cover the study area safely and using VLOS operation,
we planned three flights to cover the AOI. The planned flights are
presented in Figure 2. The flight durations were
kept under 20 minutes.
The planned flight altitude was 140 m which would
provide approximately 3 cm GSD. The flight speed was set to 5 m/s which
provided 90% forward overlap. The flight pattern and the camera used
provided 70% side overlap.
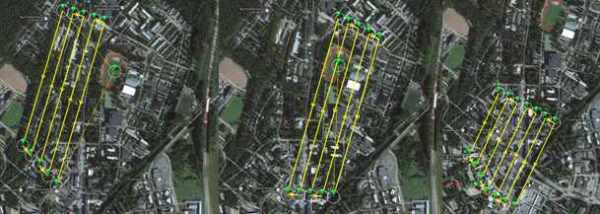
Figure 2 Planned UAV flights to the area of interest.
3.1.2 Measurements
The UAV system was a hexacopter with Tarot 960 foldable frame and the
following specifications ( Figure 3). The autopilot
was a 3DR Pixhawk with Arducopter 3.15 firmware. The payload capacity is
4 kg and the system has a 15-30 min flight time depending on payload.
The UAV trajectory was collected with on-board GPS (RasPiGNSS,
NV08C-CSM) and the used IMU was VectorNav VN-200. The imagery was
collected with Samsung NX500 RGB camera.
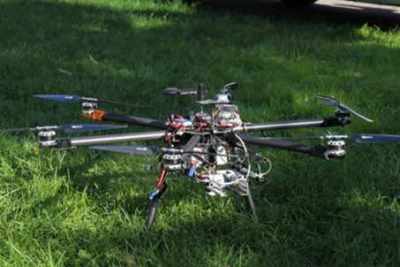
Figure 3
UAV system used for aerial imaging.
The UAV imaging was performed on September 2017 on full sunny day.
All flights were conducted on the same day. First flight was flown
around 1 pm and the last one at 5pm. The take-off areas were chosen so
that the UAV was clearly visible to the pilot during the flights. During
the flights, we had two other persons observing all direction of the
surrounding airspace in order to detect possible other aerial vehicles.
The total number of images captured with the three flights was 1334.
The initial inspection of the imagery indicated that the camera settings
had been good and although shadows were present, the objects in the
shadows were clearly visible. Altogether, 10 GCPs were placed evenly
distributed in the study area and measured using Trimble R10 VRS-RTK-
GNSS system.
3.1.3 Data processing
The image data was processed using
Pix4D software (Pix4D, Lausanne, Switzerland). Orthomosaics, DSM and
photogrammetric RGB point clods were and mesh was created. The GSD of
the processed data was 2.93 cm. The GCP root-mean-square-errors (RMSE)
were 0.0021 m, 0.0014 m and 0.0015 m for X-, Y- and Z-coordinates,
respectively. The produced point cloud had point density of
approximately 1000 points / m2 . Overview of the entire produced
orthomosaic and DSM for the study area is presented in Figure 4 and an example of produced photogrammetric RGB
point cloud and mesh is shown in Figure 5.
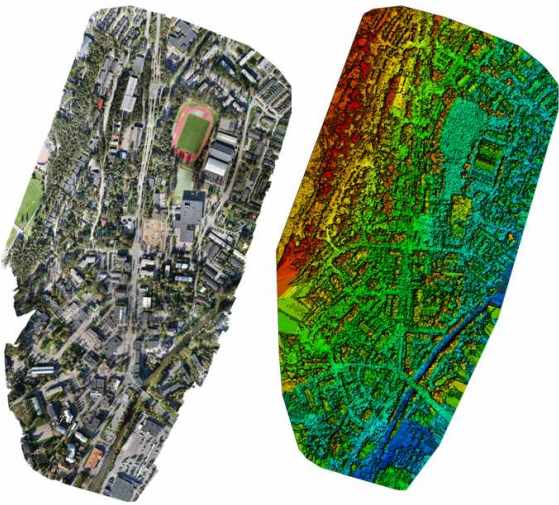
Figure 4 Orthomosaic and DSM of the area of interest derived from UAV
imagery.
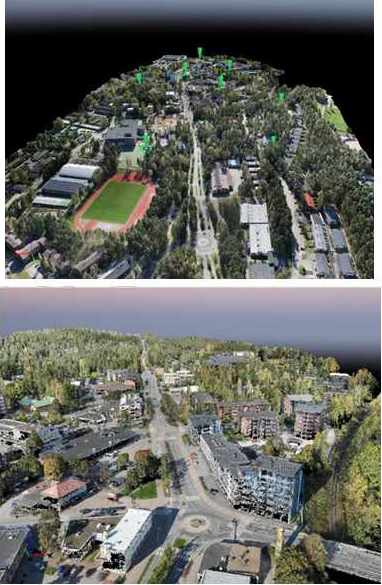
Figure 5 Mesh (top) and RGB point cloud (bottom) of the area of
interest.
3.1.4 Vectorization
Preliminary building vectorization of the data has been concentrated
on building vectorization. The vectorization has been done using
TerraScan software (Terrasolid Ltd., Helsinki) which provides good
automated methods for building vectorization. The methods have been
originally developed for airborne laser scanning (ALS) data but they
work also with photogrammetric point clouds. The main steps in building
vectorization include classification of points to ground, vegetation and
building points, smoothing of data and building facet detection from the
building points. The resulting vectorized building can be exported in
CityGML format.
Vectorization of other targets present in urban topographic
data such as roads, paths, tree lines, fences has not yet been
conducted. Preliminary results of automated building vectorization is
presented in Figure 6.
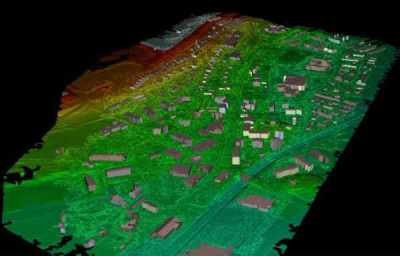
Figure 6 Automatic building vectorization performed with TerraScan
software using the photogrammetric RGB point cloud data derived from UAV
imagery.
4. CONCLUSIONS
This paper investigated the potential of using unmanned aerial
vehicles (UAV) to produce reliable and accurate 3D topographic data in
urban areas. The paper described general properties and characteristics
of different types of UAVs and presented a typical UAV system for
mapping application including its payload. Workflow for producing
accurate and reliable 3D topographic data safely and taking into account
the local legislation was presented.
The paper presented results of a test case were the described
workflow had been used to produce 3D topographic data of urban area
using UAV imagery and photogrammetry. Results showed that UAV
photogrammetry provides low cost tool for producing 3D topographic data
in urban areas, especially when small areas are of concern. The
utilization of UAVs in Finnish municipalities in topographic data
production is likely to increase notably in the future.
REFERENCES
Trafi, Finnish Transport Safety Agency, 2016, “Aviation Act
(864/2014): Use of remotely piloted aircraft and model aircraft (OPS
M1-32)”. Link:
https://www.trafi.fi/en/aviation/unmanned_aviation
BIOGRAPHICAL NOTES
Mr. Olli Nevalainen is a Research scientist at the Finnish Geospatial
Research Institute in the National Land Survey of Finland and a D.Sc.
student in the Aalto University School of Engineering. He received his
B.Sc. and M.Sc. degrees in remote sensing and photogrammetry from the
Aalto University in 2011 and 2012, respectively. His current
research include development of various remote sensing methods, such as
laser scanning and satellite- and UAV-based remote sensing, and their
applications in environmental research and mapping.
Teemu Hakala, works as a research scientist for the Finnish
Geospatial Research Institute, Department of Remote Sensing and
Photogrammetry. His research interests include UAV
sensor technology, radiometric measurements, hyperspectral environment monitoring,
hyperspectral LiDAR and radar technology.
Dr Eija Honkavaara is a Research Manager at Finnish Geospatial
Research institute and leader of the DroneFinland research center. Her
current research focuses photogrammetry and hyperspectral remote
sesnsing using drones.
Roope Näsi received the M.Sc. degree in technology in electronics
from Helsinki University of Technology, Espoo, Finland, in 2014. He is
currently working toward the Ph.D. degree with Aalto University, Espoo.
He is a Research Scientist with the Department of Remote Sensing and
Photogrammetry, Finnish Geospatial Research Institute, Masala, Finland.
His research interests include photogrammetry, unmanned aerial vehicles,
radiometric calibration, and hyperspectral environmental monitoring
applications.
CONTACTS
Mr. Olli Nevalainen
Finnish Geospatial Research Institute, National Land Survey of
Finland Geodeetinrinne 2, 02430
Kirkkonummi
FINLAND
Tel. +358408458412
Email: olli.nevalainen@nls.fi
|


