Article of the Month -
April 2010
|
Spatially Enabled Government in New South
Wales, Australia
Warwick Watkins AM and Dr. Pedro Harris, Australia


 This article in .pdf-format
(21 pages and 677 kb)
This article in .pdf-format
(21 pages and 677 kb)
1) This paper is based on the keynote
presentation of Warwick Watkins, Surveyor General of New South Wales, to
be presented at the 2nd plenary session on Spatially Enabled Society at
the FIG Congress 2010 in Sydney. The article gives an introduction to
the advanced conceptual approach to SDI as used by the Land and Property
Management Authority in New South Wales, Australia. This approach will
be further elaborated by Warrick Watkins at the FIG Congress.
Participants who are interested in gaining an indepth, practical
training on how to spatially enable LI in their jurisdictions should
register for technical tour to LPMA.
The article has been jointly authored by Warwick Watkins and Pedro
Harris and is based on a doctoral research thesis by Pedro Harris. The
research study was sponsored by the Land and Property Management
Authority, NSW, Australia.
SUMMARY
Governments worldwide are reviewing how they deliver services in the
middle of a global financial crisis. With budgets under pressure and a
shortage of investment funds there is a greater need for sharing data,
systems and infrastructure. Increasingly, there is also a need for more
informed decision-making at all levels.
To remain competitive in this environment requires decision-makers at
all levels to be informed with the best available and most current
information. Not surprisingly, there is a growing demand for
location-based analytics in the decision-making process. This is more
commonly being termed as Location Intelligence (LI).
This concept builds on the history and practice of measurement, position
and time, the core elements and underpinnings of surveying and the
understanding and application of information technology. It is the
fundamentals of surveying, the elements of information technology, and
the synergies between these two disciplines that have forged the core
elements of spatial information and LI as we know it today.
This paper addresses the issue of accelerating the adoption of spatially
enabling LI through a multi-disciplinary systems-theory framework
approach to unify business, information and technology architectures for
the delivery of location-based information. The Unified Architecture for
Location Intelligence (UA4LI) was the key deliverable from a doctoral
dissertation, sponsored by the Land and Property Management Authority,
to address adoption issues of this emerging paradigm in New South Wales
(Harris, 2010). The genesis of the UA4LI can be traced to the Enemark's
Sustainable Urban Development (SUD) framework, designed to address
informal land use and bring about sustainable development. Another
feature is that the SUD framework has strong alignment with spatial data
infrastructures, on the one hand, and on the other draws upon business
information which are both common features of LI (Enemark, 2005, 2007).
In the February, 2010 FIG Newsletter, Jude Wallace commented on how land
administration theory is being further developed as a multi-disciplinary
approach to deal with other emerging challenges associated with
sustainable development and challenges such as equitable land
acquisition principles (Wallace, 2010). Wallace’s article draws on
Enemark's pioneering work first introduced in 2004. Enemark devised the
new framework for dealing with sustainable urban development, herein
referred to as the SUD framework (Enemark, 2004). This paper, however,
discusses how the SUD framework was extended and used to develop the
UA4LI framework in support of LI developments.
The UA4LI framework is not restricted to land-use and land-management
related areas and can be used in other disciplines such as banking,
insurance, emergency management, recreation, and transport as well as in
government service delivery.
The universality of this framework is testament to the rigour of the
underpinning research work of Enemark, Wallace, Rajabifard, Williamson
et al. It is further evidence of the deep roots the discipline of
surveying and the professional application of the knowledge, dedication
and relevance of the profession has to offer to a world that is beset
with so many challenges.
1. ROLE OF SPATIAL INFORMATION IN DECISION-MAKING
1.1 Empowering the Decision-Maker
Governments worldwide are reviewing how they deliver services in the
middle of a global financial crisis following the earlier collapse of
the USA’s subprime mortgage market. The current economic crisis has
brought with it a renewed sense of survival for organisations (Shiller,
2008). While governments are not immune from the financial crisis they
are constantly on the lookout for ways to improve services and reduce
cost. With budgets under pressure, the need for sharing data, systems,
infrastructure and ideas have become critical (Butler Group, 2009a;
Rees, 2009). Public and private sector organisations acting in a
unilateral manner will not be able to survive and would need to operate
in partnership arrangements (Shiller, 2008). Sharing information
infrastructure and utilising common platforms and frameworks are some of
the contemporary approaches being considered for improved service
delivery.
The New South Wales State Plan outlined one of its key priorities for
improving service delivery by focusing on “increased customer
satisfaction with Government services” and by making current information
available to citizens over the Web and to the public service
(NSW_Government, 2006, p. 30). This implies that citizens and staff
alike should have unfettered and equitable access to information at all
levels.
Citizens want modern and efficient government services (NSW_Government,
2006). They are becoming IT savvy and are increasingly demanding new
e-government services. This phenomenon is being referred to as Gov 2.0.
At its core is a need for greater levels of transparency and access to
government information. To tackle these information management
challenges and structural reforms head on, requires greater reliance of
shared infrastructure, shared services and access to current
information. These tenets are also important criterion for
land-administration systems. Unsurprisingly, it has meant that
governments are redefining their service delivery in the market space.
To remain relevant in this environment requires decision-makers at all
levels to be informed with the best available and most current
information, which is often hard to locate and access (Butler Group,
2009; Shiller, 2008; Williamson, Rajabifard, & Binns, 2007). According
to Lee and Percival (2008), between 80 to 90 percent of all information
has a spatial dimension and is spatially related to some point such as
an address, GPS coordinates, location, post code and landmarks. This new
reality is the fuel behind the current technology explosion for maps and
being able to ‘mash up’ in real-time real-world objects and to augment
it with information held elsewhere. This ‘augmented reality’ is
essentially about being informed with the latest information anywhere
and anytime.
LI works by being able to view business information together with
location information to understand what impact different situations and
scenarios will have on a business. It provides a spatial context to
business information by geo-referencing it and encapsulating it with a
geographical information system (Lee & Percivall, 2008).
To have this capability operating at different management levels and
across business divisions requires access to fundamental spatial data
infrastructure, business information and enabling IT platforms. LI
involves processes and technologies to improve an organisation’s
effectiveness by integrating business and location-based information
within an environment of a governing framework and being delivered using
the Web 2.0 technology.
1.2 Defining the role of Location Intelligence
LI is seen as an important tool that should be used by management and
operational staff at all levels. Visualising business and location
information graphically in a composite application can achieve far much
more than descriptive text alone – a picture paints a thousand words
(source anon). Applications such as Google Maps, Bing Maps and Sensis
Whereis are used at home and in businesses to locate addresses, get
directions on how to get to places, view aerial photography to see what
the place looks like beforehand and to determine landmarks and other
characteristics of the surroundings. Overlay business information with
location information and it becomes a powerful tool.
Thus being able to collaborate with people, information, maps and
computer systems in real-time has many benefits but also has some risks.
There have been a growing number of successful LI implementations but as
the concept is still relatively new and not well understood, the full
benefits of it will not be realised until the concept becomes
mainstream. To have LI operating at a whole-of-government or at a
multi-enterprise scale requires a strategic approach with supporting
policies, frameworks and access to shared spatial services. Case studies
in NSW, Australia have shown how adoption rates are accelerated when
there are service platforms and enabling frameworks.
1.3 Location Intelligence was born in Web 2.0
The use of Internet applications has become pervasive but they are
designed primarily for mass consumer markets based on a paid advertising
model. These relatively new Internet applications are identified as
second generation geographical information system (GIS) technology where
the focus is on consumerism. The first generation of GIS was limited to
expert users such as GIS analysts. Even with the advances of second
generation GIS, primarily made available over the Internet, there are
limitations with these applications in a business setting. Data
custodians are wary about publishing data to the Internet because of
security concerns, cyber fraud and identity theft issues. Thus a third
wave is emerging where governments and large businesses are investing in
similar technology platforms for use within their enterprises.
These emerging third generation Web 2.0 applications embrace Internet
technology but operate in secure Virtual Private Networks. Subscribers
can publish their data and retain ownership over the content without the
fear of it being repurposed and on-sold without their consent.
Figure 1 provides a summary of the three communities of users, namely:
citizen, business and expert. The diagram depicts the present
environment showing all three tranches in operation. GIS Tranche-3
represents the current paradigm where the business community is the
emerging group making demands for the GIS software. LI is seen as a GIS
Tranche-3 development. In GIS Tranche-1 the market space was occupied,
almost exclusively, by the scientific community and expert analysts.
With GIS Tranche-2 came millions of users who became interested in
Internet mapping applications developed by companies such as Google,
Telstra and Microsoft. LI is continuing to evolve and is being
integrated directly into many applications using Web 2.0 technology in a
business setting (Sheina, 2009).
Business communities have been locked in between these two extremes, not
needing raw data but requiring information that has been optimised for
their business needs to support decision-making.
Figure 1, Comparative Display of the GIS Tranches
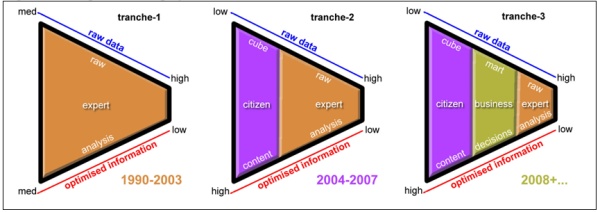
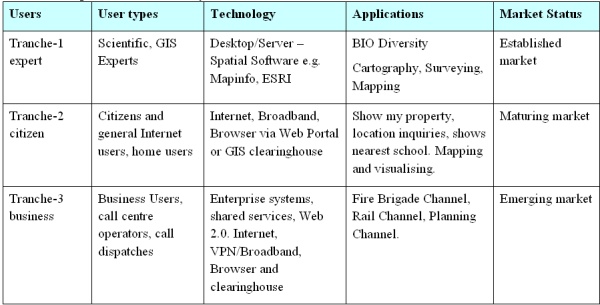
Table 1 provides a summary of the three tranches, a market indicator,
user defined groups, technology users and applications uses. All three
tranches are in operation today and are at different levels of maturity
– see market status column in Table 1.
Table 1, Comparative Factor Analysis of the GIS
Tranches
The impacts of GIS Tranche-3 applications
With the third tranche emerging, being fuelled by the need for
decision support, there is bound to be impacts on existing spatial
infrastructures, such as:
- -Greater reliance and requirement for government shared services
such as the Spatial Information Exchange platform;
- Demand for greater collaboration services supporting “mash ups”
or information layering;
- Proliferation of web services and service oriented architecture
initiatives;
- Requirement for web service repositories and catalogues to
publish web services and metadata to support search and discovery
efforts; and
- Provision of government spatial services to mobile users – for
infield workers such as Fire Fighters, Surveyors, Accredited
Valuers, Police and other mobile staff.
1.4 Why Web 2.0 and Gov 2.0?
The advent of Web 2.0 and maturity of web services and standards are
changing the way organisations work. This has brought a raft of new
technology and concepts to the market place in a very short space. The
IT landscape is now awash with new concepts such as cloud computing,
social networking, crowd-sourcing and spatial “geo-hubs” which are
impacting on the way organisations work and operate (Huberman, 2008).
Gov 2.0 is a worldwide movement using Web 2.0 technology in a bid to
redefine government using social networking as a medium to discover what
citizens want from government. Various governments have formed task
forces to deal with this. In NSW, this movement has been spearheaded as
NSWsphere (Sharpe, 2009).
The central tenet of this new wave of technology is on collaboration
and hence its use in defining “e-democracy”. Collaboration involves
people interacting, in real-time, with people and businesses wherever
they are and using any connected device they have access to such as a
mobile phone, personal digital assistance (PDA), laptop or television
set. Similarly, computers collaborate and share services and data using
the same underlying technology. This same technology has been used to
deliver new GIS solutions and increasingly for decision-support
applications.
The pressures of building and maintaining a sustainable business
involves a process of continual improvement, adapting to new
circumstances and ensuring staff have the necessary skills, tools,
information and systems. Increasingly, LI is being considered as a
mandatory and fundamental management tool. Current and accurate
information is recognised as a key ingredient for decision support
systems (Williamson, et al., 2007). New market economies are being
developed around subscription based content and increasingly the demand
for the best-available spatial information will increase.
These challenges and technology shifts are most currently observable
in the spatial industry with the convergence of location-based services
(LBS); with integration in mobile computing devices such as mobile
phones and PDA devices; with GIS applications such as Google Maps and
in-vehicle navigation systems. When the combined worth of the industry
is considered as a whole with LBS companies such as TomTom
International, Magellan, Garmin and Nokia to name a few, together with
satellite and global positioning networks, and GIS application software
vendors such as Google, Microsoft, ESRI, Leica and MapInfo, it is a
staggering sum (Vaughan-Nichols, February 2009). It serves to highlight
the significant developmental changes that are occurring within this
industry and specifically for the GIS Tranche-2 and 3 environments.
1.5 Economic Driver for Location Intelligence
The Australian Cooperative Research Centre for Spatial Information
(CRCSI) and the Australian and New Zealand Land Information Council
(ANZLIC) commissioned ACIL Tasman in 2007 to conduct an independent
quantifiable analysis of the value of spatial information to the
Australian economy in the 2006-07 financial year (ACIL-Tasman, 2008).
The CRCSI report found that spatial information industry revenue in
2006/07 was around $1.37 billion annually and contributed a cumulative
gain of between $6.43 billion to $12.57 billion dollars in GDP
(ACIL-Tasman, 2008).
Spatial information by itself has little intrinsic value but the
value is increased when it is used (Cutler, 2008). Hence, the value of
spatial information is derived from its contribution to the
decision-making process (ACIL-Tasman, 2008, 2009; Longhorn & Blakemore,
2008; Masser, 2007).
The CRCSI report also highlighted that the lack of access to spatial
information has constrained direct productivity impacts on consumption
of GDP by at least $0.5 billion than might otherwise have been realised
(ACIL-Tasman, 2008).
Despite the economic losses due to limitations of
access to spatial information the study highlighted the potential
trend where “the contribution of spatial information is likely to
increase as spatial information becomes a mainstream enterprise
resource”(ACIL-Tasman, 2008, p.xii).
In addition, the CRCSI report identified other areas where knowledge
gaps existed and recommended further investigation in areas such as:
- Data infrastructure – priority areas that could include
interoperability, standards and systems, progressing the concept of
a Virtual Australia;
- Data access – technologies and systems to provide simple and
effective access, developing consistency between data access
portals.
Besides, there are a range of other intangible benefits such as its
role in security, biosecurity, national mapping, environment, climate
change and land and property registers (ACIL-Tasman, 2008; Tang &
Selwood, 2005; Williamson, et al., 2007). Location-based analytics is a
mechanism that can be used in support of these functions. Tang and
Selwood (2005, p.3) support the idea that “Better, faster access to
information leads to better-informed decisions and actions”. Thus, UA4LI
is about facilitating access to spatial information as a mainstream
resource.
1.6 Spatial Interoperability
The Australian Government Information Management Office (AGIMO 2007)
argues that the “impetus for business process interoperability stems
from the increasing need for collaboration within and between agencies
in the delivery of services” (p.13). The corollary holds true for
spatial interoperability where there is a need to share spatial
information for improved service delivery. Drivers of spatial
interoperability include responding to increasingly complex social and
environmental problems requiring access to a range of data. Hence,
spatial data interoperability is about providing access to core
fundamental spatial data layers to better informed and more
discriminating customers (ACIL-Tasman, 2008). Despite the positive gains
in recent years in spatial technology, interoperability is still impeded
by lack of infrastructure and archaic access restrictions (Budhathoki &
Nedovic-Budic, 2007).
The term “Spatial Data Infrastructure” (SDI) is often used to denote
the relevant base collection of geographic technologies, policies and
institutional arrangements that facilitate the availability of, and
access to spatial information (GSDI, 2004, 2008). In NSW, the concept of
an SDI is the geographic information technology component of
e-government, and therefore there us a strong reliance on government
actively supplying core framework data (Onsrud, 2007).
SDIs provide the “basis for spatial data discovery, evaluation, and
application for users and providers within all levels of government, the
commercial sector, the non-profit sector, academia and by citizens in
general” (GSDI 2004, p. 8). SDIs found in developed nations are
comprised of several elements such as: metadata, geographic data,
framework data (cadastre and topography), standards and services (GSDI,
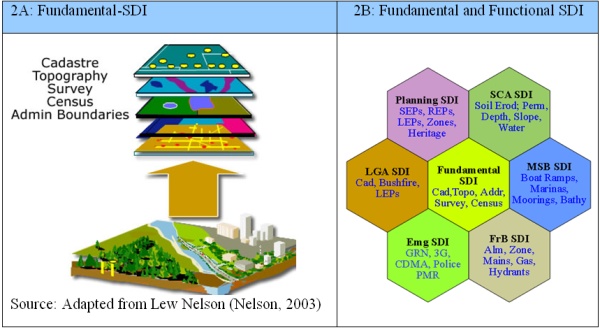
2008). This can be seen illustrated in Figure 2.
The SDI is comprised of the fundamental-SDI layers as shown in Figure 2
(column 2A) and other functional geographic data such as planning,
emergency management, maritime and so forth. Figure 2 provides an
illustration of the fundamental-SDI and composite functional-SDIs.
Figure 2, Fundamental-SDI Elements
Spatial information is impeded by both “soft” interoperability and
“hard” interoperability. Soft interoperability deals with non-functional
and non-technical limitations imposed by people through their
unwillingness to share, licensing restrictions and pricing regimes. Hard
interoperability, on the other hand, deals with infrastructure,
technical limitations, data quality issues, data currency and up-to-date
metadata (Budhathoki & Nedovic-Budic, 2007). Omran, Breght et al (2007)
are of the view that personal factors may affect individual decisions to
share spatial data and cites psychological responses such as attitudes,
experience, empathy, fatalism, motivation, trust and ability to cope
with uncertainties as some of the barriers to overcome. Omran, Breght et
al (2007) commented that organisational resistance to share spatial data
is a real obstacle to exploiting spatial data infrastructures. In the
past it was the technology or lack of technical capacity that impeded
access to spatial data infrastructures but now the problem seems to have
shifted from hard interoperability concerns to soft interoperability
issues (ACIL-Tasman, 2008; Omran, Bregt, & Compvoets, 2007).
Very rarely do all geospatial datasets reside in one organisation and
hence cooperation and data sharing amongst organisations have become
essential (McDougall, Rajabifard, & Williamson, 2007). Traditional data
sharing arrangements have involved the physical transfer of data files
and in order to reduce data duplication, spatial data sharing (SDS) over
the Web is considered essential (Omran, et al., 2007). Thus, with
advances in communication technology, data sharing is now possible via a
remote connection over the Internet, and this obviates the need for
conventional file transfers. Location-based analytic requirements are
determined when a single item of data may be used in many different
ways, a theme commonly shared with the SUD theory.
2. ENEMARK SUD FRAMEWORK
2.1 Overview of SUD Framework
The SUD Framework was designed as a universal framework to address
land-management and land-use issues. The SUD Framework recognises that
each country will have its own land management issues, administration
idiosyncrasies, differing legal frameworks and land registry systems and
yet still provides the flexibility for a generic model (Williamson,
Enemark, Wallace, & Rajabifard, 2010). Each country has its own land
administration systems for implementation of its land-related policies
and land-management strategies thus providing a country’s infrastructure
for economic development (Williamson, Enemark, Wallace, & Rajabifard,
2008). The model works within a jurisdiction or country context, or
Spatial Data Infrastructure (SDI) “zone”, which sets the political and
legal framework (Cho, 2005). Enemark (2007) found that the SUD Framework
operates best within a jurisdiction, a country context or “SDI zone”
which sets the political and legal framework. This is illustrated in the
country context frame and includes such things as business requirements
and problem identification and sets out what needs to be accomplished.
Having identified the country context the model then operates by
bringing together the process information made up of the policy
framework, land-functions and land-infrastructure. The various data
sources provide information to tackle economic, social and environmental
issues around land management and land use. Figure 3 provides an outline
of the components of the SUD Framework (Enemark, 2007).
Figure 3, Enemark Sustainable Urban Development Framework
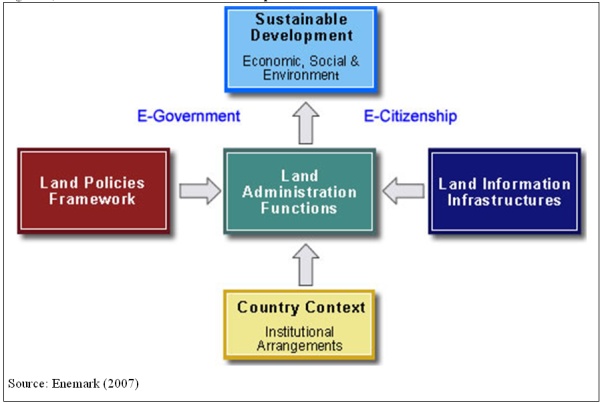
Enemark’s framework provides the requisite information architecture
of spatial determinants to assist governments, environment architects,
town planners and the like to make informed choices. The framework is
best summarised as follows:
The framework for political decision-making
should therefore be organised to facilitate an integrated approach
to land-use management that combines the three areas of land
policies, land information management, and land-use management.
(Enemark 2007, p. 1).
The SUD Framework is an amalgam of land and property rights,
restrictions and obligations drawn together seamlessly with data from
functional line-of-business systems, spatial infrastructure systems and
facilitated within a governance framework (Enemark, 2007, 2008;
Williamson, et al., 2007).
2.2 SUD Framework Adapted for LI
In Figure 4 the model for LI is inverted to direct the flow from top
to bottom rather than the inverse which is the case with the SUD
Framework. The rationale for this change is twofold. Firstly, writing in
English generally flows from top to bottom, left to right. By placing
the Business (Context) at the top, this provides readers with the sense
of the desired flow – LI starts with business need, then it is processed
by ingesting the framework, functions and infrastructure requirement and
the output is the delivery solution for the LI channel. Secondly, the
Unified Architecture is designed as a process model embracing three
distinct phases of input-process-output (IPO). In business modelling,
the process flow diagrams start at the top and work their way to the
bottom. Thus the reason for inverting the business context diagram as
shown in Figure 4.
Figure 4, Unified Architecture for Location
Intelligence adapted model
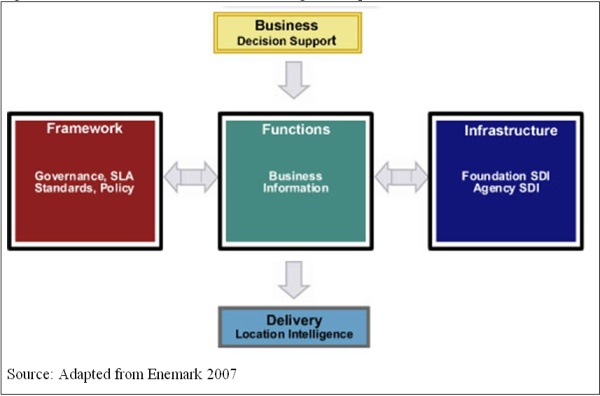
The adapted model places far more importance on the Business Context,
the starting point, rather than the Delivery Platform, the solution. The
other changes are the directional flow arrows of the process boxes. The
SUD Framework shows the process flows converging on Functions while in
contrast the arrows are bi-directional with the UA4LI Framework. The
cross domain involvement can be seen illustrated in the following
examples. Example: security requirements (being an element of the
Framework domain) can extend across all domains. A Framework domain
element for security such as an Information Security Management System
(ISMS) provides overarching statements of applicability for the other
domains.
Conversely, an Infrastructure domain web service requires security
instructions for a service bind and therefore needs to relate to the
Framework domain. A Function domain exposing a line-of-business service
may require packet encryption which is dictated by the Framework domain.
These examples show how a domain can interact with another domain.
However, the SUD Framework does not make this distinction with its
direction flows. The models are at different scales – one at a
high/conceptual level as compared with a business/logical level. At a
conceptual level the directional flows of the SUD Framework are linear
leading to the desired outcome at a national or country context. The LI
Framework is more focused on a Business context and the interactions are
at a more granular level and hence the process flows are bi-directional
dealing more with the solution delivery input and outputs.
Alignment of Frameworks Domains
The Unified Architecture components are comprised of five domains, as
contrasted in Table 2. The UA4LI Framework correlates and aligns to the
SUD Framework domains, where the:
- Business domain deals with requirements for
decision-support, innovation, economic drivers, corporate drivers
and value propositions for sharing data;
- Framework domain caters for non-functional requirements,
governance arrangements, service level agreements, access policies,
standards and typically “soft” issues;
- Function domain is about business information held mainly
in line-of-business systems, methods of access, enterprise web
services and online transaction processing (OLTP) methods;
- Infrastructure domain is about spatial data
infrastructure, access methods to this data, spatial information,
and metadata and data standards. Included are access methods such as
Open Geospatial Consortium (OGC) web services and online analytical
processing (OLAP); and
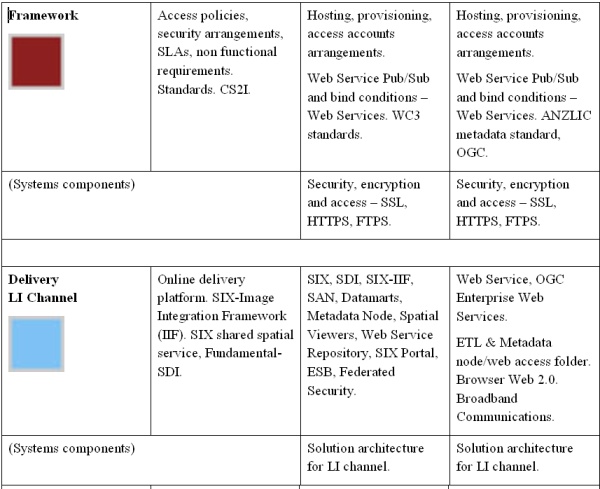
- Delivery domain is about the platforms that underpin the
delivery of the solution, the systems components, the technical
environments, enterprise platforms, service platforms, integrated
framework, enterprise service and message bus and portal delivery
systems, typically “hard” issues.
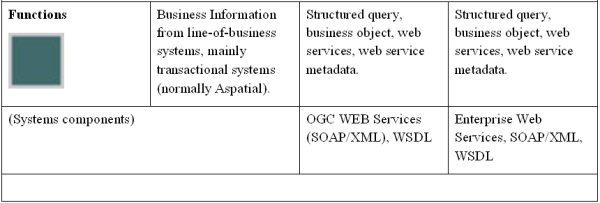
Table 2, Enemark Framework -LI Adaptability
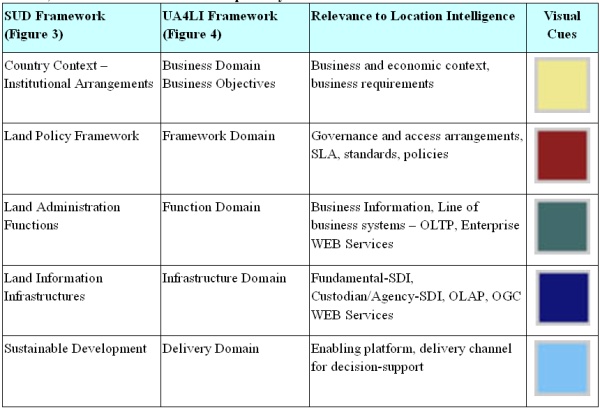
Table 2 shows how each of the LI domain components map and relate to
the SUD Framework with matching visual cues for each domain.
2.3 Domain Mapping
The SUD Framework and UA4LI framework as illustrated in Figures 3 and
4, respectively, lists five domain themes, namely, business domain,
framework domain, function domain, infrastructure domain and delivery
domain. Each domain theme has a specific purpose as described:
1. Delivery domain
The delivery domain is concerned with the product outcome. It deals with
the technical platforms and solution architecture that are needed to
deliver the information to the decision-makers.
Invariably many of the data sources required to support the SUD process
come from several data custodians and could be in varying forms. Some
custodians offer web services and others may only provide the data on
tape or on portable mass-storage devices to fulfil the requirements. The
raw data may have to be post-processed into a format so that it can be
used in the SUD solution.
2. Framework domain
The framework domain caters for non-functional requirements, governance
arrangements, legislation, service level agreements, security, policies,
standards and typically “soft” interoperability issues. It includes
issues such as privacy considerations, data access and permission
rights, governance, licensing, restrictions, pricing and imposed digital
rights. It establishes the authorising environment to bring about SUD
outcomes.
3. Functions domain
The functions domain focuses on the transactional data held in
land-registers and other line-of-business systems such as valuations and
titling information. These are typically business systems or
land-administration systems (Williamson, et al., 2008). Methods of
access to this data vary and are far more sensitive than spatial data.
Contemporary methods involve secure web services for online transaction
processing systems (OLTP). Functional data can be obtained with web
services on a transaction by transaction basis. Business objects
described as web services can provide answers to queries without
supplying the full dataset.
4. Infrastructure domain
The infrastructure domain is concerned primarily with spatial data
infrastructure such as cadastral data, topographic data, aerial or
satellite photography and other spatial data sets. The SUD framework
draws heavily on fundamental spatial data infrastructure held by mapping
and land-administration organisations. It also includes other functional
spatial data from natural resource and local government authorities. The
authoritative data from these organisations provide many of the base
“fundamental SDI” layers (Akinyemi, 2007).
5. Business domain
The business domain addresses the business imperatives and context for
the SUD framework. It deals with innovation, economic drivers,
environmental impacts, political and policy outcomes. The key drivers of
the business domain are to inform political decision-making and to
provide an integrated approach to land-management, land-information and
land-use (Enemark, 2007; Williamson, et al., 2008).
3. UNIFIED ARCHITECTURE FOR LOCATION INTELLIGENCE
The UA4LI Framework is comprised of a “Four Step” process to assist
with implementing location intelligence solutions. At the conclusion of
Step 4 an organisation wishing to implement an LI solution would be able
to evaluate the requirements and make an informed decision about
proceeding. The Framework leads to the delivery of solution architecture
blueprints for an LI implementation. Starting with Step 1, each “step”
builds on the other, identifies stakeholder involvement, provides an
overview and description of what is expected, a context diagram and a
deliverable output.
Drawing on the collective outputs from each step the goal is to describe
the LI solution architecture and delivery environment.
Figure 5, UA4LI Framework presented as a step
through matrix
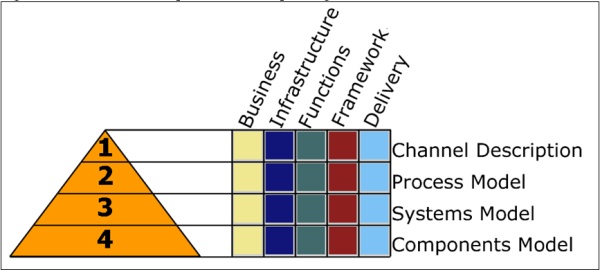
Figure 5 is presented as a pyramid or iceberg where there is more
detailed information at the base than at the top. Each step has a
deliverable; this can be seen on the vertical plain: channel
description, process model, systems model and components model. Each
step is comprised of five domains represented in the SUD Framework in
colour on the horizontal axis and includes: business, infrastructure,
functions, framework and delivery. Step 1 is at a high level and Step 4
contains more detail.
Step 1 is to provide a high level description of the
business objectives and sets the overall context. The deliverable
output is a Channel Description document. The Channel Description
deliverable contains summary details, at a high level, of
stakeholder information and descriptive narratives of each of the
five domains.
Step 2 is focused on the business processes and
information perspectives needed to inform decision makers. The
deliverable output is a Process Model that includes an inventory of
business use cases, information requirements, business objects and
target systems where source data resides.
Step 3 is focused on the systems processes and data
perspectives needed to describe the solutions architecture and
service platforms. The deliverable output is a Systems Model that
bridges and links systems requirements to the business deliverables
gathered in earlier steps. The deliverable includes a systems use
case inventory and descriptions of web and enterprise services.
Step 4 provides a unified detailed description of the
business and systems requirements. The deliverable output is a
decomposed Components Model of the LI solution. Components are
described for the presentation, services and data integration
layers.
3.1 UA4LI Domain Alignment
When aligning the UA4LI Framework to the SUD Framework traces of all
domains can be found. This is seen illustrated in Table 3. The ‘UA4LI
Elements’ column describes the domain names; ‘Business Context’ gives a
description about the domain; ‘Shared Service’ describes the spatial
shared service; and Agency/Business describes the Agency and/or other
party data.
Table 3, Systems Elements Matched Against UA4LI
Framework
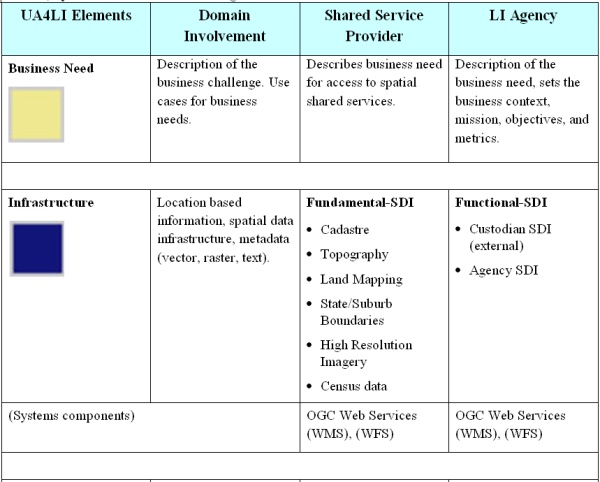
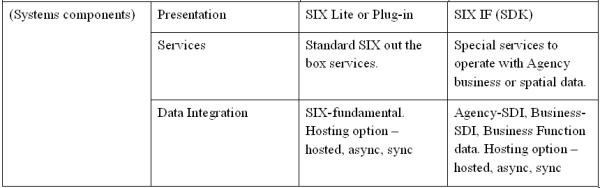
The UA4LI Framework is designed to take in the business and
information requirements which are used to develop the systems
requirements. Next, the solution architecture is produced for delivering
the information via the online LI channel. The UA4LI systems components
provide the basis for the solution architecture of the service platform.
The Systems Model deliverable describes responsibilities of the
Agency/Business and distinguishes between the roles of shared service
provider.
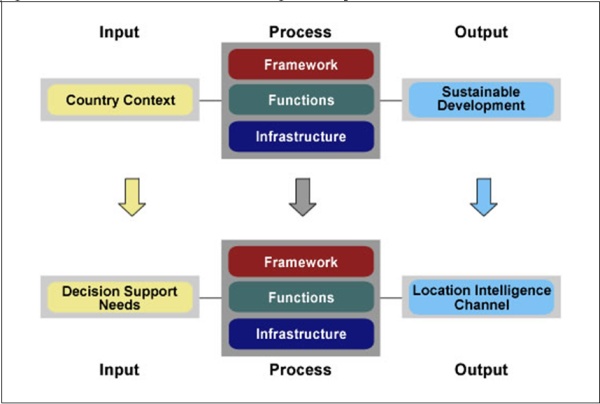
4. CONCLUSION
As identified above, the Enemark SUD Framework provides a framework
for addressing land-management and land-use issues. It describes
universal problems faced by many nations in terms of managing land
resources and creating sustainable environments. The SUD Framework is
aimed at equipping governments and societies with information to better
manage their land resources. The outcome is certainly geared toward
better decision making and for making informed choices about the
environment. As a corollary, the Location Intelligence paradigm aims at
aiding decision making and to arm managers and operational staff with
better information. The changes between the two frameworks can be
observed in Figure 7. The major change differences are shifts from the
macro level to a micro level; from country to business and from outcome
to output. The Country Context is changed to become the Business Context
and the Sustainable Development outcome is changed to be the LI Delivery
Channel.
Location Intelligence, as previously defined, is the art of
leveraging unified location information for business intelligence. The
purpose behind Location Intelligence (LI) is to be able to view business
information together with location information and understand what
impact different situations and scenarios will have on an organisation.
A LI Channel can be developed to support the objectives of the SUD
framework.
Location Intelligence (LI) extends traditional Business Intelligence
(BI) through the use of GIS technology by integrating business
information with location data and encapsulates the use of geographical
information in decision-making at all levels. It involves processes and
technologies to improve an organisation’s effectiveness by arranging
available business and location information and relating it to
fundamental Spatial Data Infrastructure.
Figure 6, Unified Architecture Location
Intelligence Components
The commonalities between the systems components of LI and SUD
Framework are similar in many ways. Firstly, the Fundamental-SDI
components are the same. Secondly, the Enterprise Web services are the
same, with both providing access to business function data. Thirdly, the
framework elements are similar in terms of governance, access
arrangements, security and non-functional requirements. These
similarities provided a strong basis for adapting the Enemark SUD
Framework into a generic unified framework for Location Intelligence.
This work highlights the interdependences between the fundamental
principles of surveying, namely measurement and position, and the
empowerment that technology has given to the interpretation and
application of the SDI elements that are inextricably linked to
position. It also demonstrates the need for these to be seen through the
eyes of business decision-making and problem-solving to achieve the
social wellbeing of all citizens, and the attainment of sustainable
communities, environmental conservation and economic development.
REFERENCES
- ACIL-Tasman (2008). The Value of Spatial Information: The impact
of modern spatial information technologies on the Australian
economy. Melbourne: Prepared for the CRC for Spatial Information &
ANZLIC – the Spatial Information Council.
- ACIL-Tasman (2009). Spatial information in the New Zealand
economy: Realising productivity gains. Melbourne: Prepared for Land
Information New Zealand; Department of Conservation; Ministry of
Economic Development.
- Akinyemi, F. O. (2007). Spatial Data Needs for Poverty
Management. In H. Onsrud (Ed.), Research and Theory in Advancing
Spatial Data Infrastructure Concepts (pp. 33-54). Redlands, CA: ESRI
Press.
- Budhathoki, N. R., & Nedovic-Budic, Z. (2007). Expanding the
Spatial Data Infrastructure Knowledge Base. In H. Onsrud (Ed.),
Research and Theory in Advancing Spatial Data Infrastructure
Concepts (pp. 7-31). Redlands, CA: ESRI Press.
- Butler Group (2009). 2009 Trends to Watch: Government Technology
BFTC2188. Retrieved 6 March 2009, from
http://www.datamonitor.com/
- Cho, G. (2005). Geographic Information Science: Mastering Legal
Issues. Milton, QLD: John Wiley & Sons.
- Cutler, T. (2008). Venturous Australia, building strength in
innovation. Canberra.
Enemark, S. (2004). Building Land
Information Policies. Proceedings of Special forum on Building Land
Information Policies in the Americas. Retrieved 01 March 2010, from
http://www.fig.net/pub/mexico/papers_eng/ts2_enemark_eng.pdf
- Enemark, S. (2005). Supporting Capacity Development for
Sustainable Land Administration Infrastructures. Paper presented at
the The Eighth United Nations Regional Cartographic Conference for
The Americas (UNRCCA), New York.
- Enemark, S. (2007). Integrated Land-Use Management for
Sustainable Development Retrieved 4 March 2009, from
http://www.land.aau.dk/~enemark
- Enemark, S. (2008, 2008). Land Administration Systems - Managing
Rights, Restrictions and Responsibilities in Land. The Geospatial
Resource Portal Retrieved July 2009, from
http://www.gisdevelopment.net/application/lis/policy/mwf09_stig.htm
- GSDI (2004). Developing Spatial Data Infrastructures. In D.
Nebert (Ed.), The SDI Cookbook (Vol. 2): GSDI Association.
- GSDI (2008). Global Spatial Data Infrastructure Association
Retrieved 5 June 2008, from http://www.gsdi.org/
Harris, P.
(2010). Unified Architecture Framework for Location Intelligence.
Charles Sturt University, Bathurst.
- Huberman, B. A. (2008). Crowdsourcing and Attention. Computer
Innovation Technology for Computer Professionals, IEEE Computer
Society, 103-105.
- Lee, C., & Percivall, G. (2008). Standards-Based Computing
Capabilities for Distributed Geospatial Applications. Computer
Innovation Technology for Computer Professionals, IEEE Computer
Society, 50-57.
- Longhorn, R. A., & Blakemore, M. (2008). Geographic Information:
Value, Pricing, Production, and Consumption. Boca Raton: CRC Press.
- Masser, I. (2007). Building European Spatial Data
Infrastructures. Redlands, CA: ESRI Press.
McDougall, K.,
Rajabifard, A., & Williamson, I. p. (2007). A Mixed-Method Approach
for Evaluating Spatial Data Sharing Partnerships for Spatial Data
Infrastructure. In H. Onsrud (Ed.), Research and Theory in Advancing
Spatial Data Infrastructure Concepts (pp. 33-54). Redlands, CA: ESRI
Press.
- Nelson, L. (2003). Data Model for Law Enforcement. Redlands:
ESRI Press.
- NSW_Government (2006). A new direction for NSW: STATE PLAN
SUMMARY. Retrieved 01/09/2008. from
http://www.nsw.gov.au/stateplan/pdf/Summary_complete.pdf.
- Omran, E.-S. E., Bregt, A., & Compvoets, J. (2007). Spatial Data
Sharing: A Cross Cultural Concept Model. In H. Onsrud (Ed.),
Research and Theory in Advancing Spatial Data Infrastructure
Concepts (pp. 33-54). Redlands, CA: ESRI Press.
- Onsrud, H. (Ed.). (2007). Research and Theory in Advancing
Spatial Data Infrastructure Concepts. Redlands, CA: ESRI Press.
- Sharpe, P. (2009). NSW Public Sphere: Government 2.0 Retrieved 7
September 2009, from
http://pennysharpe.com/nswsphere
- Sheina, M. (2009). Location Intelligence Trends. Ovum Retrieved
22 September 2003, from www.ovum.com
- Shiller, R. J. (2008). The Subprime Solution: How Today's Global
Financial Crisis Happened, and What to Do about It. Princeton:
Princeton University Press.
- Tang, W., & Selwood, J. (2005). Spatial Portals: Gateways to
Geographic Information. Redlands, CA: ESRI Press.
- Vaughan-Nichols, S. J. (February 2009). Will Mobile Computing's
Future Be Location, Location, Location. Computer Innovation
Technology for Computer Professionals, IEEE Computer Society, 14-17.
- Wallace, J. (2010). Land Acquisition in Developing Economies.
FIG e-Newsletter February 2010 Retrieved 07 March 2010, from
http://www.fig.net/pub/monthly_articles/february_2010/february_2010_wallace.html
- Williamson, I., Enemark, S., Wallace, J., & Rajabifard, A.
(2008). Understanding Land Administration Systems. Paper presented
at the International Seminar on Land Administration Trends and
Issues in Asia and The Pacific Region. from
http://www.csdila.unimelb.edu.au/publication/conferences/Understanding%20Land%20Administration%20Systems.pdf
- Williamson, I., Enemark, S., Wallace, J., & Rajabifard, A.
(2010). Land Administration for Sustainable Development. Redlands:
ESRI Press Academic.
- Williamson, I., Rajabifard, A., & Binns, A. (2007). The Role of
Spatial Data Infrastructures in Establishing an Enabling Platform
for Decision Making in Australia. In H. Onsrud (Ed.), Research and
Theory in Advancing Spatial Data Infrastructure Concepts (pp.
121-132). Redlands, CA: ESRI Press.
BIOGRAPHICAL NOTES
NSW Land and Property Management Authority
The Land and Property Management Authority (LPMA) consists of Land
and Property Information (LPI) - titling, valuation, surveying, and
other spatial information; Crown Lands administration and management -
land leases and licences, reserves and State Parks and land uses from
cemeteries to iconic development/business sites to tourist and
recreation areas; Native Title and Aboriginal Land Claims; Soil
Conservation Service - including soil conservation earthworks and
consultancy services, Land Boards and the Emergency Information
Coordination Unit - spatial data needs for counter terrorism and
emergency services planning, research and consequence management, the
Office of Rural Affairs and the Office of Biofuels, the State Property
Authority, Hunter Development Corporation, Festival Development
Corporation and the Lake Illawarra Authority.
Warwick Watkins AM, is the Chief Executive Officer of the NSW Land
and Property Management Authority.
Warwick graduated from Hawkesbury Agricultural College at Richmond,
now part of the University of Western Sydney with Honours (HDA, Hons)
and gained further postgraduate degrees and diplomas from the University
of New England in Armidale, including a Masters Degree in Natural
Resources (MNatRes, DipSciAgr). He also studied at the Harvard Business
School in Boston in the United States of America (AMP:ISMP).
email:
warwick.watkins@lpma.nsw.gov.au
Dr. Pedro Harris, the Chief Information and Technology Officer
(CITO) of the NSW Land and Property Management Authority.
Pedro holds a Doctor of Business Administration (DBA) from Charles
Sturt University, and a Master of Public Administration (MPA) from
Monash University.
email:
pedro.harris@lpma.nsw.gov.au
LPMA and SIX Websites
http://www.lpma.nsw.gov.au
http://www.six.nsw.gov.au
 |


