Article of the Month -
August 2010
|
Terrestrial Laser Scanning for Mainstream Land Surveying
Mike PINKERTON, New Zealand
 This article in .pdf-format (10
pages, 5.51 MB)
This article in .pdf-format (10
pages, 5.51 MB)
1) This paper has been prepared and presented at
the FIG Congress 2010 in Sydney, Australia, 11-16 April 2010. This paper
provides a good introduction for those who are thinking about the
question whether to invest in laser scanning.
Handouts of this presentation as a .pdf file.
SUMMARY
Terrestrial Laser Scanning is quite legitimately starting to take a
larger stake in the domain of mainstream land surveying. This
technological advancement is similar in significance for the industry to
what RTK GPS was doing a decade or so ago, and it seems only logical
that over the next decade 3D scanning technology will evolve into a
mainstream tool in the arsenal of most land surveying organizations.
This paper overviews some typical projects where Terrestrial Laser
Scanning is changing peoples perceptions of the complexity, accuracy and
efficiency in which spatial data can be captured by the modern surveyor.
The examples are presented in easily digestible overview format,
including the benefits and limitations encountered.
1. INTRODUCTION
Towards the latter half of the 1990’s I was embarking on the early
stages of my professional surveying career. At that stage real time
kinematic GPS was starting to emerge as the latest and greatest in the
world of conventional surveying, following on from the success of
post-processed GPS which had revolutionized certain measurement
applications, but had failed to capture the imagination of many in
mainstream topographical surveying. Within that field surveyors have
traditionally been cautious when it comes to adopting new technologies;
after all in many cases the tried and tested methods covered their
requirements for long periods of time.
Being a young, carefree, globe trotting surveyor, I soon realized the
potential in using RTK GPS and pushed the case for hiring it in for
project work where it had clear benefits. This soon evolved to working
freelance chasing project work which utilized the technology. The
factors that contributed towards to the slow uptake of this technology
by the mainstream land surveying industry were apparent for all to see:
- Lack of understanding of the potential applications (by both
surveyors and their clients);
- Lack of understanding about the benefits
- Lack of understanding about the limitations
- Lack of personnel trained in the use of the equipment
- High capital outlay required for the technology
The end result was that using traditional tried and tested techniques
were often the fall back position. However over the last decade the
above factors have slowly been mitigated, to a point where RTK GPS (or
its modern derivatives such as Network GNSS) have become commonplace, if
not indispensible in our industry.
When I first saw laser scanning in action a couple of years ago, I
saw many parallels to what I had witnessed in the 1990’s with GPS. Laser
scanning was not in its infancy, it had been carving out a niche in
certain spatial applications for well over a decade. However it was, in
my opinion, on the verge of breaking out as a serious contender in the
field of mainstream surveying. The familiar obstacles, as listed above
as items 1 to 5, lay in its way. It seemed only logical to me that the
next 5 years would see similar infiltration to a point where scanning
will become a mainstream tool in the land surveying industry.
This paper examines some recent examples to illustrate where the
technology is currently being put to good use within the surveying
discipline of Aurecon in Australasia.
2. DIGITAL TERRAIN MODELLING APPLICATIONS
In large open areas which require efficiency of data collection at a
level of accuracy not obtainable by LiDAR (or a scale where the cost of
LiDAR can not be justified), TLS is a very viable option, and have the
added bonus of being able to produce some nice looking outputs to go
along with the standard deliverables such as contour models and volume
calculations.
2.1 Example 1: Earthworks Stock take Volumes: Tauriko Land
Development, Tauranga New Zealand
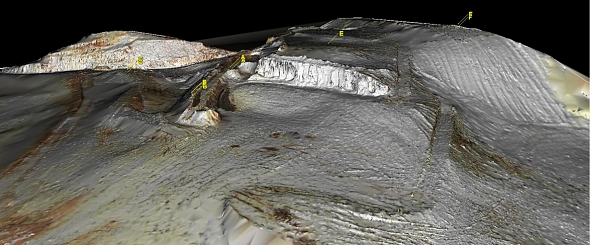
Overview of the 3D model of the Earthworks site.
Project Overview:
7ha earthworks site, Tauriko Industrial Estate Stage 2, Tauranga, New
Zealand.
Purpose of Survey:
Creation of digital terrain model to calculate volume of earth
excavated since beginning of current earthworks season (surface
comparison).
Scanning Method:
Scanning from vantage points around the site: 8 setups used over 7 ha
area, with scan targets used to merge individual scans together. Target
points were coordinated concurrently by RTK GPS to coordinate scan in
terms of project control. Total 5 hours on site (2 surveyors used)
including a cross section surveyed by GPS to verify scan model
Traditional Method:
RTK GPS, typically 3 days surveying by 1 surveyor, with the ground
model generalized by major changes of grade and sampled spot heights.
Potential health and safety hazards include the surveyor walking around
live excavation areas and having to walk close to the top of steep
embankments to capture the change of grade string.
 |
 |
|
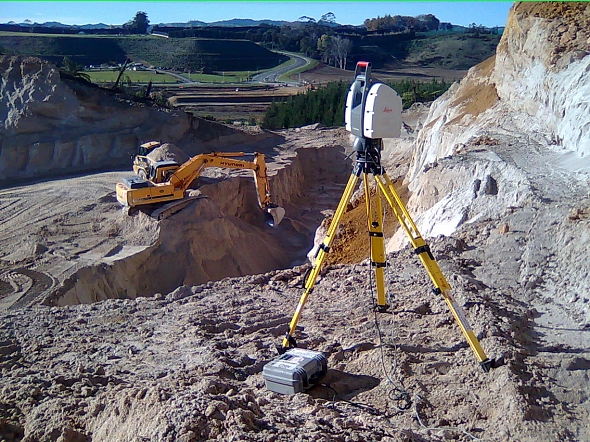
Scanning in operation during the excavation
of one of the areas, and the resulting gound model (decimated) |
Benefits of Scanning:
- Far more accurate detail captured for the ground model;
- Scanning undertaken whilst plant operating on site (earthmoving
machines later removed from the scan model using Lowest Returning
Signal algorithms);
- Minimal exposure to the largest Health and Safety risks on site:
moving plant and falls from height;
- Saving on site work meant the stock take volume could be
captured within 1 day;
- 3D visualization was used to bring the site to life on the
computer screen for the project managers.
Limitations:
- Scan model typically a few cm above GPS model because scan model
more likely to capture high points in uneven ground, and GPS pole
typically penetrates surface slightly
- Scanning would have been more difficult in marginal weather.
- A couple of minor shadow areas existed in the model where detail
was not as complete as the rest of the model
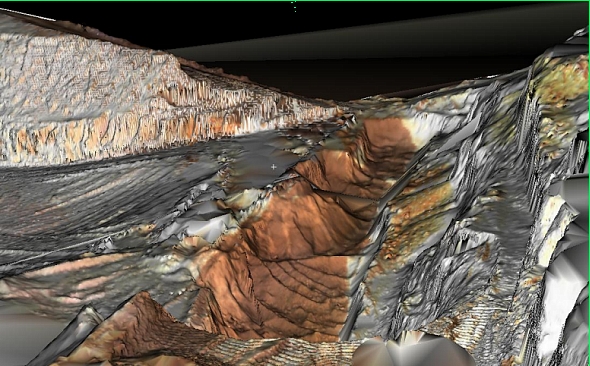
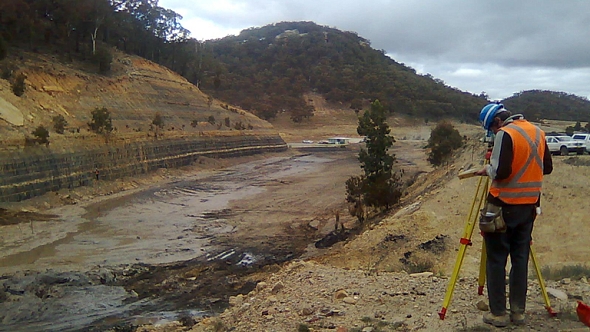
2.2 Example 2: Highwall at Centennial Mine, Airly, New South
Wales, Australia
Project Overview:
500m of highwall (in 2 locations) as part of a topographical survey
of the subject site.
Purpose of Survey:
Supply of detailed ground information for site prior to the
commencement of excavation for the coal seam drilling.
Scanning Method:
Scanning from 5 locations on the embankment, merged into 1 digital
terrain model decimated to an average of 1 point per 0.5m, then exported
to be processed in 12D along with the topographical detail captured on
the rest of the site. Total time on site was less than 1 day, including
site induction requirements.
Traditional Method:
In the preliminary survey of the site, reflectorless total station
measurements were taken at various locations along the high wall to
model the general slope. For safety reasons, no personnel were allowed
on or above the highwall without specialist equipment and training,
along with a task specific safety plan.
Benefits of Scanning:
- Efficiency of data capture incorporating a higher level of
detail;
- No requirement to access on, above or below the wall
- Effective 3D visualisation created of the survey as a bonus
delivery to the client
Limitations:
- Not all vegetation removed automatically by the processing of
the ground mesh therefore quite a few data spikes had to be taken
out manually;
- Some areas were heavily eroded with deep ruts (which would
typically be ignored by a surveyor) so the decimated ground model
was quite spiky in some areas on the bank, however decimation had to
be applied to ensure the ground model file was not too large to be
handled by other software.
 |
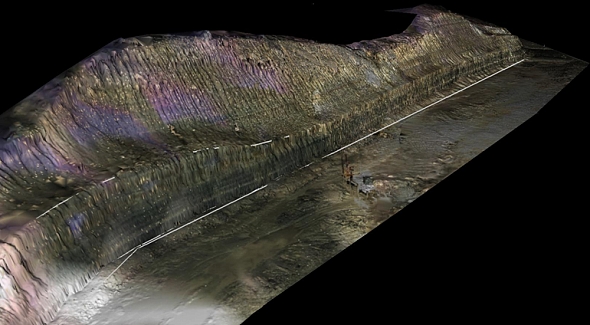 |
|
Overview of the site and resulting gound
model |
3. CIVIL INFRASTRUCTURE
Through the recent economic downturn it has been general
infrastructure work that has kept many firms in business as governments
sought to buy their way out of recession through investment in various
projects. As firms look for a competitive edge, the use of laser
scanning can provide not just a point of difference but a smarter more
innovative way of approaching many of the spatial requirements of these
projects.
3.1 Example 3: Johnsonville Rail Tunnel Upgrade, Wellington, New
Zealand
Project Overview:
Over the course of 2008 Aurecon (formerly Connell Wagner) was
commissioned to work on the Johnsonville Rail Upgrade project to develop
a new highly optimised track alignment through seven horseshoe shaped,
brick lined, tunnels which were more than 100 years old. Each tunnel was
between 100-200m long.
Purpose of Survey:
The goal was to enable significantly larger passenger trains to pass
through with a minimum amount of modification work to the tunnels. The
spatial modelling approach developed by Aurecon utilised laser scanning
technology to build 3D models of the tunnels to the requisite accuracy
to be utilised in the rail alignment redesign and clearance modelling.
Scanning Method:
The scanner was used to ”Traverse” through each tunnel with a setup
just outside each portal, and an average of one setup per 60-100m inside
the tunnel (depending on curvature). All scanning was conducted at night
during a 5 hour line shut down period at an average of between 1 and 2
tunnels per night. Resulting point cloud models were reduced to cross
sections at between 1 and 4 m intervals (depending on curvature)
including inside running edge of rails, overhead wire position, and
minimum clearance to tunnel wall.
Traditional Method:
Prior to laser scanning I would have carried out a job like this by
traversing through the tunnel and capturing cross sectional shapes using
reflectorless total station (probably using someone with a laser pointer
to scribe out each section on the wall so that you could see where you
were pointing), or alternatively that person holding a prism on the wall
at each measurement location (and thus requiring the overhead wire to be
turned off). This is a very slow method if considering the level of
detail required on this project, and does not guarantee that you are
always capturing the wall at the point of minimum clearance.
Benefits of Scanning:
- Efficiency of data capture far exceeds any conventional method;
- Accuracy of tunnel modelling estimated at +/-20mm at the 95%
confidence level at any location in the tunnel relative to the fixed
survey control points;
- No downside about working at night in poor lighting conditions.
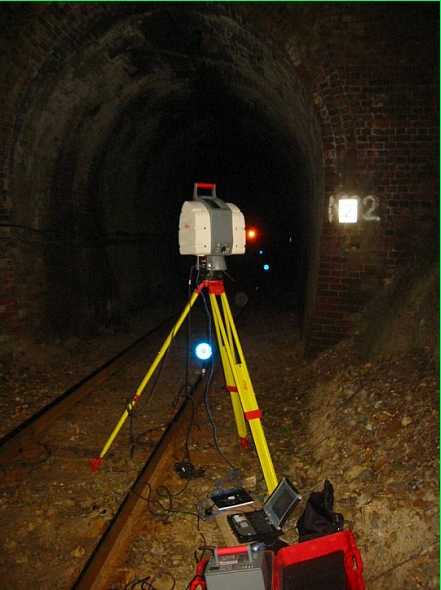 |
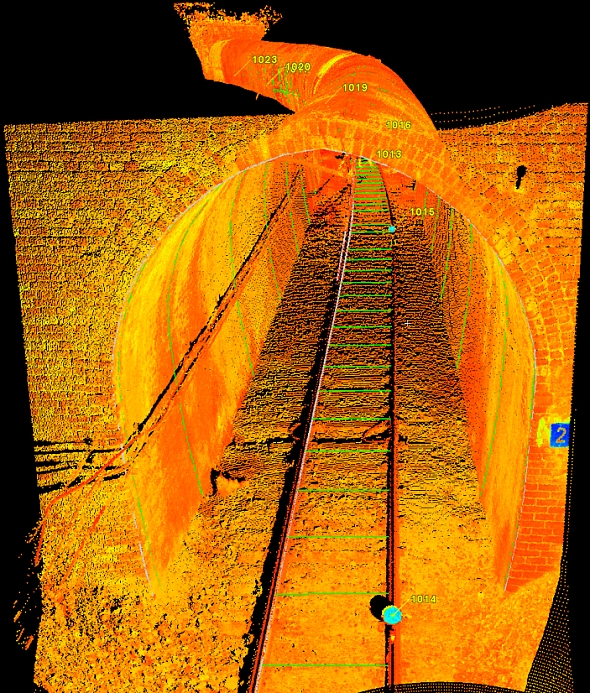 |
|
Typical scanner setup and resulting view of
the point cloud (with some modelled elements shown in green) |
Limitations:
- Some damp areas of tunnel walls resulted in extra setups being
required closer to the damp areas;
- Processing time was quite labour intensive to extract clearance
sectioning in the required format because scan software provided no
functionality in this regard.
3.2 Example 4: Watermain Upgrade and Pipe Replacement, Auckland,
New Zealand
Project Overview:
Modification of prefabricated polyethylene pipe which did not fit the
bend it was designed for.
Purpose of Survey:
The open excavation of the pipe bend location was in the middle of a
major urban arterial road in the city. However the prefabricated pipe
did not fit the excavated curve and therefore the spatial location and
the direction of the pipes ends at the extremities of the excavation
were required, in addition to the shape of the prefabricated pipe lying
nearby the site. Once this information was captured an iterative
approach with the contractor was undertaken to derive the preferred
modifications to the existing pipe using the resources they had on site,
achieving a shape that could be coupled to the existing pipes, and could
be installed clear of the existing utility services in the trench.
Scanning Method:
2 Scanner setups were used to capture the trench details (1 on the
floor of the trench, and 1 just above one end), and 2 scanner setups
were used to capture the shape of the prefabricated pipe. All the
pipework on site modelled as spatial elements within Cyclone software
was then imported into AutoCAD for spatial manipulation and drawing
outputs for the contractor.
Traditional Method:
A double prism pole would be used to capture the spatial location of
the existing pipework within the confines of the trench, as well as the
prefabricated pipe shape, however the risk of any proposed modification
still resulting in a misfit, or clash with any other elements in the
trench meant that the laser scanning could be easily justified in this
case.
Benefits of Scanning:
- Rapid and complete data capture within the confined space of the
existing trench
- Complete and accurate modelling of the prefabricated section of
pipe
- 3D virtual modelling of the pipe modification to prove the
solution would work on site
Limitations:
- The cost of the solution to the client was slightly higher that
conventional methods therefore the value of the risk mitigation had
to be justified;
- Bulky equipment (including cables, laptop and battery) to move
in and out of trench.
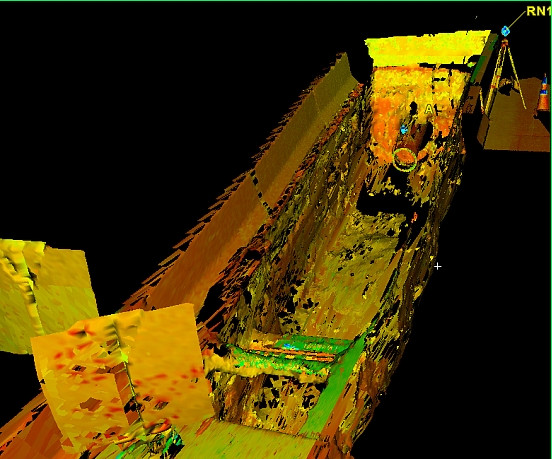
Meshed view of one end of the excavation trench.
4. PLANT AND INDUSTRIAL APPLICATIONS
This has traditionally been the field where laser scanning has
developed over the past 10 years, as surveyors and engineers are often
called on to provide spatial measurements in complex environments. Where
as conventionally one might provide distinct measurements at various
locations (maybe cross referenced against photographs), laser scanning
can be a viable option where more complete information is required, or
limitations exist regarding the ability to make direct measurements.
4.1 Example 5: Pipe Expansion Deformation, Swanbank PowerStation,
Queensland, Australia
Project Overview:
Modelling of the High Pressure, Low Pressure, Cold Reheat, and Hot
Reheat pipework between the steam generators and the turbines.
Purpose of Survey:
Measure the deformation of main steam pipework between shutdown
(cold) and running (hot) conditions to cross check against expected
movements, as well as provide as-built drawings of the pipework
dimensions.
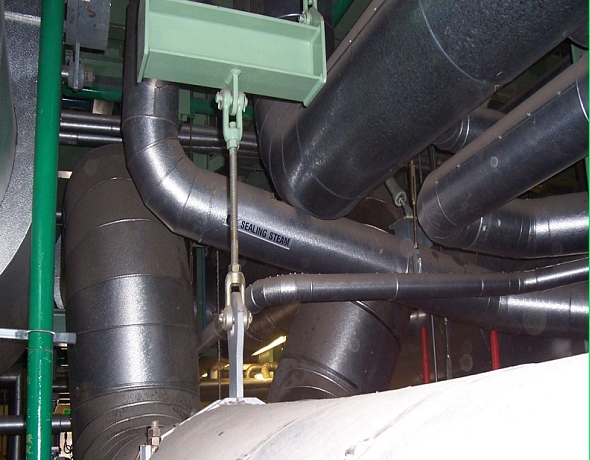
Typical view of the complexity of pipework around which the 4 main pipes
weave.
Scanning Method:
32 to 36 scanner setups over 3 days were used during each of the two
surveys to capture enough data on the four pipes, including their
accurate locations at each of the support points. Pipe movements were up
to 200mm between hot and cold positions. Adhesive scan targets were
installed on walls and beams to provide control between the 2 scans, and
residuals on these marks were typically less than 5mm between the two
surveys. Pipe positions were compared at each of the support points to
derive
DX,
DY
& DZ
values between the two surveys, to an estimated accuracy of +/- 5mm (1
s.d.).
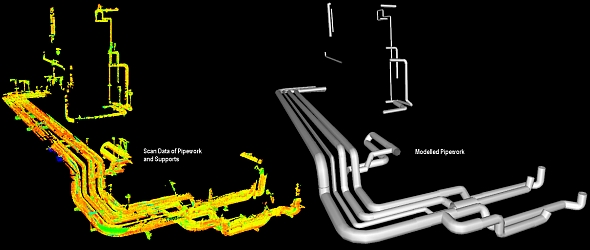
Overview of the point cloud data and modelled pipework following the
cold scan data capture
|
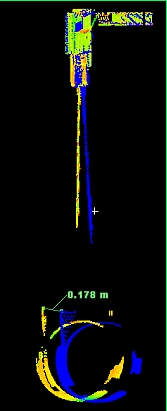
Typical comparisons between cold and hot scan positions. |
Traditional Method: Movements have traditionally
been measured by the installation of fixed targets (often
painted on the pipes) to measure the movement at distinct
locations. Some support points allow direct measurement at that
location (e.g. a sliding plate joint, or a spring loaded lower
support). The lack of as-built drawings for even modern plant is
testament to the fact that creation of these drawings is not a
straight forward surveying task in most cases and drawings are
often left incomplete.
Benefits of Scanning:
- Efficiency of data capture
- Completeness of data capture
- Mitigation of the risk to need to revisit the site for
additional measurements
Limitations:
- Many setups required to capture full 3D information in
areas often obstructed by plant or scaffold (in the case of
the cold survey conducted during the shut down period when
many other people were working on site). If only distinct
locations are chosen to measure they are often chosen in
locations which are easiest to see.
- Processing time is required to clean up scan data, model
pipework, and measure deformations from the scan model.
|
5. CONCLUSION
Highlighted in this paper are just a few examples of how Terrestrial
Laser Scanning solutions have been applied on projects where up until
very recently traditional surveying methods would have been the norm. As
more people are made aware of the benefits that laser scanning bring,
then their expectations from their spatial data suppliers will rise
accordingly. Concurrent with this change in attitude will be ongoing
further refinement of technology (both hardware and software). The end
result will be that laser scanning technology, like real time GPS did
before it, will inevitably become commonplace within the realm of
mainstream land surveying.
REFERENCES
All content within this paper have come from the personal experience
of the author.
Special thanks to Geoff Munns of Aurecon’s Auckland office for peer
review of this paper.
BIOGRAPHICAL NOTES
Mike Pinkerton (BSurv – Otago University; MNZIS) is a Senior
Surveyor based in Aurecon's Tauranga office and has over 13 years
professional experience within the surveying discipline. He has
extensive experience in the application of GPS and Laser Scanning in
surveying as well as working on large scale engineering and
topographical surveys in Australasia, Southeast and Central Asia, UK,
the Middle East and North Africa.
In his current role within the Survey discipline of Aurecon he
provides specialized input, support, and management for project work
across the Asia Pacific Region within Aurecon’s different market groups:
Community Infrastructure, Transport, Buildings, Water, Energy, Mining
and Industrial.
CONTACTS
Mr. Mike Pinkerton
Community Infrastructure
Aurecon
58 Cross Road, Sulphur Point
P. O. Box 2292
Tauranga
NEW ZEALAND
Tel. +64 21 378738
Fax +64 7 578 6143
Email:
pinkertonm@ap.aurecongroup.com
Web site: www.aurecongroup.com
 |