Article of the Month - January 2020
|
Detection of Service Pipes and the Risk of
Collapsing Sinkholes at the Lake of Constance in Switzerland Using
Ground Penetrating Radar (GPR)
Edi Meier, Inma Gutiérrez, Marco Baumann, Max
Bosshard, Rainer Heeb, Switzerland
 |
 |
 |
| Edi Meier |
Inma Gutiérrez |
Max Bosshard |
This article in .pdf-format
(14 pages)
This paper was presented at the FIG Working Week
2019 in Hanoi, Vietnam. The paper describes how Ground Penetrating Radar
is used to document the present underground condition of the water front
of the harbour promenade in Arbon (Lake of Constance) in Switzerland.
This nondestructive method gives as a result images of the subsurface
structures as well as of installations like service pipes.
SUMMARY
After a severe winter in Switzerland, two sinkholes opened suddenly
on the much used water front of the harbour promenade in Arbon (Lake of
Constance), following a time span with intensive wind that brought big
waves to the shore. The public building authority is responsible for the
safety of the boardwalk. They decided not only to search for further
sinkholes but also to document the present underground condition. This
will be used for the forthcoming restauration work. In order to get a
precise underground documentation of the area a Ground Penetrating Radar
(GPR) survey was executed. This nondestructive method gives as a result
images of the subsurface structures as well as of installations like
service pipes. The underground structure of the port facilities is
clearly shown in the radar images (reflectograms). For the city council
of Arbon this radar documentation is a helpful tool for the emergency
decisions as well as for the planning of the future lakeshore
constructions.
1. EXTREME CONDITIONS IN THE DOCK OF ARBON
1.1 Use of harbour during summertime
The city of Arbon on the Swiss shore of the southern Lake of
Constance is famous for the “Summerdays”-festival. The festival
activities with openair concerts and temporary funfair installations
extend from the fairground plaza along the entire esplanade (Fig. 1).
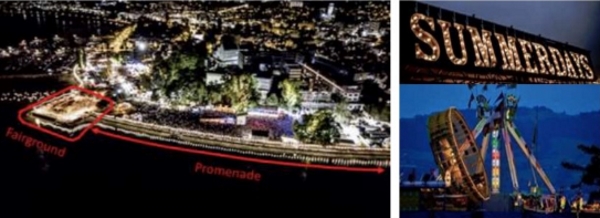
Fig. 1): Summerdays-festival in Arbon, Lake of Constance, Switzerland
[3].
1.2 Situation in winter 2018
During winter 2018 extreme climatic conditions prevailed in the area
of the Lake Constance. At the beginning of February the lake water level
was higher than the since 1881 measured data (Fig. 2). Driven by a
strong north wind big waves lashed to the shore of the promenade. With
temperatures below zero the whole area was covered by a dangerous ice
shield (Fig. 3 left).
One month later, when the ice melted away, the ground under the
fairground plaza and under the pedestrian promenade suddenly collapsed
(Fig. 3 right). Only the massive retaining wall did not tumble down and
formed a bridge (Fig. 4 left). Apparently, the poor condition of the
shore ramp and the high water level - in combination with the strong
north wind - was the cause for the soil erosion. The lakewater could
penetrate through openings and cracks in the wall (Fig. 4 right) and
loosened the ground when freezing.
The city council was worried and assumed more hidden holes in the
underground (Bosshard M., 2018). This would be a major risk for the
coming "summerdays"-festival.
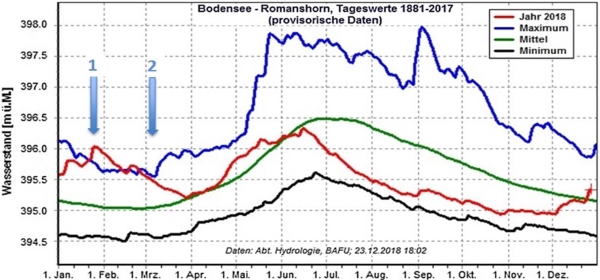
Fig. 2): Water level fluctuation of the Lake Constance since 1881.
Red curve = curve for the year 2018, green curve = mean water level,
black curve = min. water level, blue curve = max. water level.
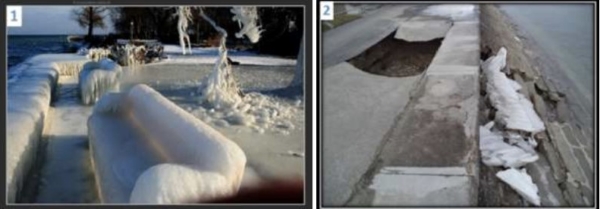
Fig. 3): Ice shield on the shore in February (left) [4]. Collapsed
ground after the melting of the ice in March 2018 (right).
2. GPR INVESTIGATION
2.1 Task
In March 2018 GPR investigations were carried out. The goal was to
detect hidden large holes in the ground that could cave in. At the same
time, the city council wanted to get a documentation of the underground
conditions for the future shore restoration. The measurements were
executed on the pedestrian promenade, the fairground plaza and on two
associated shore ramps. Parallel lines were recorded per zone. The
"radargrams" represent either a profile in depth or a profile
perpendicular to the ramp. Additionally 43 parallel profiles with a
spacing grid of 50 cm were executed, that allowed a 3-D analysis of the
underground.
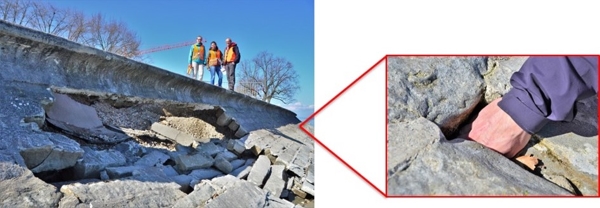
Fig. 4): Collapsed site near the promenade (left). Holes between the
stones in the ramp (right).
2.2 Process of the measures
Two areas were investigated: the pedestrian walkway and the
fairground plaza, both with associated ramp. The measured data were
collected in five parallel rows. During the first measurements, there
were still a few icy places on the shore. A GPR system with shielded
250- / 700-MHz double antennas was used (Fig. 5 above).
During the entire series of measurements, the data was collected
simultaneously with the 700 MHz antenna as well as with the 250 MHz
antenna - in other words - twice. For a detailed analysis of the first
three meters depth, the data of the 700 MHz antennas were evaluated. In
order to locate deeper objects, the data of the 250 MHz antennas were
also analysed. In the upper zone, that is to a depth of three meters and
thus close to the surface, “radargrams” with a higher resolution are
possible using the 700 MHz antennas.
A week later the two profiles on the shore ramp were executed. For
this purpose, two carriages were built, a guiding carriage for the quay
wall and a carriage for the ramp wall. They were fixed together with a
rope-system.
In the meantime the ice had melted away, but the sloping shore was
still very slippery. Because of the high waves and heavy rain, the field
work was done wearing a dry suit.
The guiding carriage was equipped with a precision trigger wheel.
This released a measurement every 5 cm interval. The carriage with the
radar antenna on the ramp wall was pulled with the same speed as the
guiding carriage. Thus, the metering of the ramp profiles is always
comparable to that of the profile F1 on the quay wall.
The surface of the stones on the ramp wall was relatively uneven and
some obstacles had to be overcome. Because of the widely supported
suspension of the radar antenna, these obstacles gave less error signals
in the reflectograms than expected.
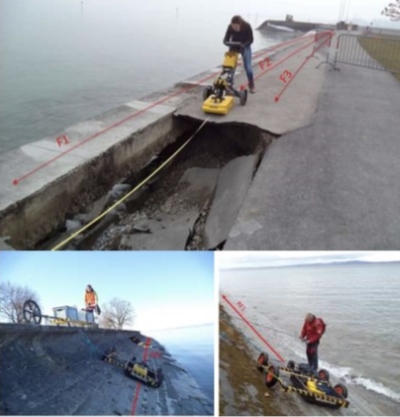
Fig. 5): GPR shots along the promenade: Three profiles on top of the
path, view towards the fairground plaza (top picture), two profiles on
the ramp wall, view in the opposite direction (pictures below).
2.3 Measuring method
A radar pulse is emitted from the transmission antenna into the
ground, which is reflected at interfaces of rock packages or layers in
the underground (Fig. 6). Thereafter, the pulse returns to the receiving
antenna where it is recorded. The time that elapsed between transmission
and reception of the pulse provides information about the depth of the
object (reflector). The strength of a reflection serves as a clue to the
electrical properties of the material that caused the reflection.
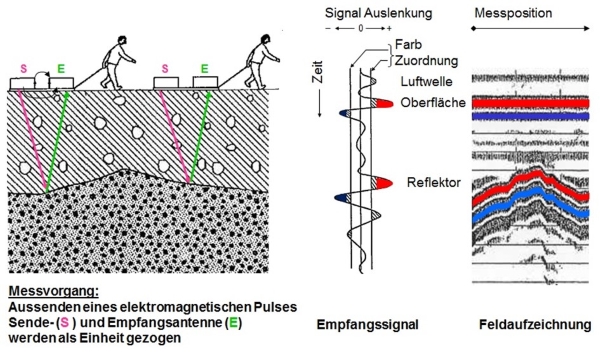
Fig. 6): Principle of GPR measurement (Meier E. et al., 2002)
A measurement is always recorded as a profile. To do this, the echoes
of the transmitted radar pulses are recorded point by point along a line
(profile line). The reflection pattern is used to interpret the
condition of the subsoil. The resolution of the achieved GPR mapping
structures depends on the antenna frequency and the scan rate along the
profile line.
2.4 Datapresentation and Dataanalysis
On top of the “radargrams” the length scale is given in meters, on
the left the signal propagation time in nanoseconds and on the right the
depth scale in meters. The depth specification is calculated from the
signal propagation time and the signal speed. The value of the depth
specification is only to be regarded as a guideline value. The zero
point of the vertical axes corresponds to the terrain surface.
The “radargrams” are checked for conspicuous structures, that is
diffraction patterns, so-called hyperbolas. They are caused by locally
limited strong reflectors such as pipes, manholes, cavities, etc. In
addition, linear structures are analysed, that can provide information
on geological stratifications in the underground. In order to specify
the depth of located objects or structures, the knowledge of the
propagation velocity of radar waves is necessary. For this purpose a
guideline value of v = 0.1 m/ns has been used in the “radargrams”. For
an exact depth specification, the depth scale would have to be
calibrated with the location of known pipes etc. or with data from
drilling holes.
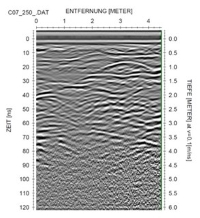
2.5 Examples from the measurements on the promenade
The “radargrams” recorded on the pedestrian path show clear
structures up to about 4 m depth. Profile F3 was taken at a distance of
2 meters parallel to the quay wall. Figures 7 and 8 show the same
section as profile F3, but were recorded with two different frequencies.
While the 700 MHz antenna shows smaller structures (Fig. 7), the 250 MHz
antenna achieves greater depth penetration (Fig. 8).
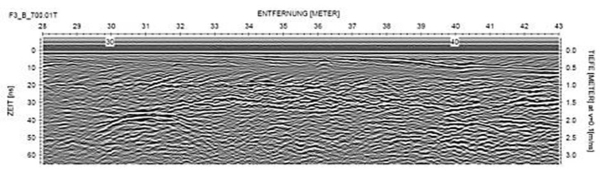
Fig. 7): Part of profile F3, taken with the 700 MHz antenna.
On both pictures is the same structure clearly visible: a structure
up to 1 m depth, that slopes to the left, is seen on the left half on
the “radargram” as well as the departure tracks of the construction
machines on the right half.
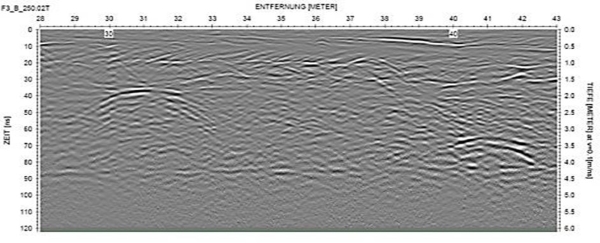
Fig. 8): Part of profile F3, taken with the 250 MHz antenna.
When interpreting these images, it must be ensured that they are not
to be regarded as a direct image of the underground. For example, a
highly reflective object can not only be seen vertically below the radar
antenna, but it is already recorded from an oblique angle from the
receiving antenna. In the “radargram” it is displayed perpendicular to
the profile. This leads to the above-mentioned “bow shape” (hyperbolas).
This can be seen on the “radargram” of profile F1 taken on the Quai
wall: there is a regular pattern of hyperbolas (Fig.9). Four transverse
reinforcing bars per meter create this pattern. The hyperbolas in the
“radargram” simulate a continuous arcuate support structure, that
certainly does not correspond to the reality. In fact, the “reinforcing
bars” are likely to be only a few cm in width.
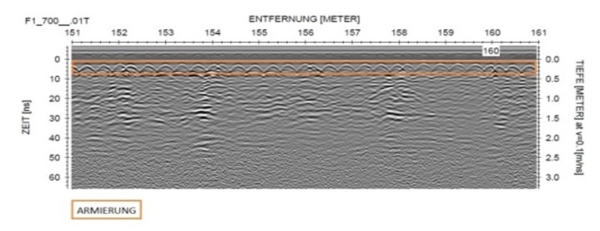
Fig. 9) Part of profile F1 on the quay wall, taken with 700 MHz
antenna. Reinforcing bars draw hyperbolas in the “radargram”. At the
apex of each hyperbola is a “reinforcing bar” in transverse direction to
the profile.
To correct these "artefacts" the geophysical processing method
"migration" is used. This method recalculates the hyperbola branches to
a circle, the actual origin of this object. However, migration only
makes sense if the hyperbolas cover underlying structures or if steep
structures are present. We recommend to keep the hyperbolas in the
“radargram” and to analyse them. The position and depth of the object
can be determined just as well without migration, because the objects
are always at the vertex of the hyperbola.
In addition to cavities large stones or rubble can produce comparable
hyperbolas, as both air and stones have a different electrical
conductivity from the surrounding material. It is a fact, that the
electrical conductivity of the ground changes greatly at the apex of a
hyperbola.
The depth and size of an object detected in the “radargrams” can be
determined with a model calculation. For this purpose, a reflection
hyperbola is calculated and placed over the “radargram”. The shape of
the hyperbola is calculated from the “travelled” distance, the diameter
of the object and the mean velocity of the radar waves in the overlying
rock layer. In addition, the hyperbola shape is influenced by the angle
at which an object is cut. In our analysis we used in all “radargrams”
for the conversion of the run-time in depth the value of 0.1 m/ns.
Depending on the material that lies above the object, this depth
conversion must be adjusted.
As an example, the analysis of the object in 2 m depth at profile
position 31 m in the radar profile F3 is shown in Fig.10.
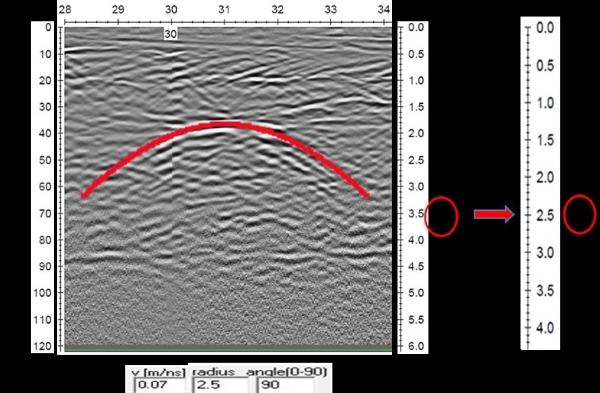
Fig. 10): Model hyperbola adapted to the object in Fig. 8. The depth
scale on the right corresponds to the calculated speed of 0.07 m/ns
adapted in the model.
The model hyperbola gives a speed of 0.07 m/ns. The depth scale must
therefore be corrected at this point by a factor of 0.7. This slower
speed indicates that clayey material has been deposited over the object.
The model calculation of the value of the diameter of the object gave a
result of 2.5 m. However, it could also be an elongated object (pipe)
cut at a shallow angle. This would result in a comparable flat model
hyperbola. Since the object is not seen in the neighbouring profiles,
this interpretation is much more likely. A cavity washed out by the lake
can thus be excluded.
2.6 Analysis of the 3-D measurements on the fairground plaza
The 50cm line grid recorded on the fairground plaza allows both a 3-D
interpolation of the ground in the longitudinal and transverse
directions as well as a plane representation with depth (see Fig. 11).
These pictures are “put together” in the form of a film document. It can
be played on any video player program and stopped at any depth. In the
plane view, in 1.1 m depth, lines (=pipes) can be seen, which are shown
as a “Y-shape”. At a depth of 2 meters you can see a dense track in the
middle of the area and at the margin a deposit of landfill material is
assumed, because all the area is artificially filled up. On the basis of
these findings, dredging slits were executed to corroborate the
interpretation.
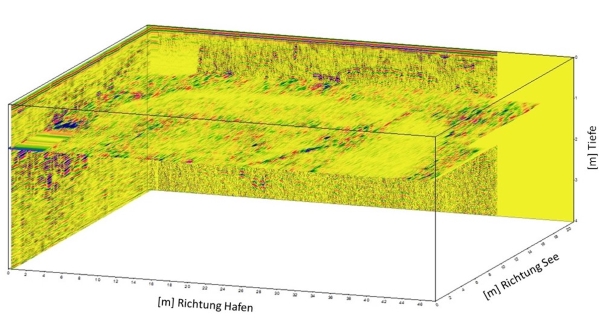
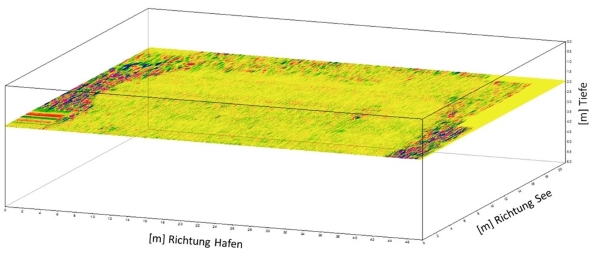
Fig. 11): 3-D images: In the plane view, lines are visible as a
„Y-shape“ in 1.1 m depth. The lower picture shows the level at a depth
of 2 m. Here, especially on the left and right side of the area, there
are highly reflective zones.
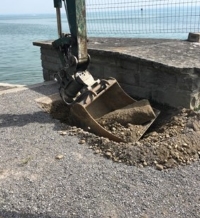
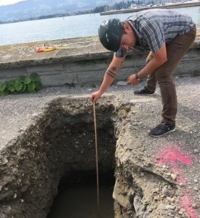
The dredging slits to the left and right of the site did not show the
expected clayey landfill material. At first a large block of stone
appeared, which caused the hyperbola (Fig. 12, left and center). Below
the stone there followed potato-sized, round stones without finely
granulated material. Water immediately flowed through the large cavities
between the stones, (Fig. 12, right), which explains the change in the
reflection signals at a depth of 2 meters. This shows that there is a
rapid hydraulic connection to the lake water on the edge of the plaza
and that a lot of fine grained material from the original fill is washed
out. With great certainty it could be ruled out that the ground on the
plaza would suddenly collapse. At the most, slow subsidence can occur
when more fine grained material is washed out.
Fig. 12): The Profile C7 has a distinct hyperbola (picture left). The
excavation brings out a large stone block (middle picture). The
remaining excavated material consists of round stones of 3 - 5 cm
diameter with little finely granulated material. The water flows
immediately (picture right).
3. CONCLUSION
With the GPR method, the soil can be quickly “x-rayed”. However, the
interpretation is not always clear, as not the strength but the
electrical properties of the subsurface is shown. On the one hand, both,
air and large, dry stones will produce similar images. On the other
hand, water that penetrates into cavities can greatly modify the image.
Thus, even after 30 years of experience with GPR, we cannot rule out
misinterpretations.
Probing with a dredge slit or with drill-holes has the advantage of
visually identifying the layer sequence at a particular location. But
using the GPR method will in short time and without destruction help you
to determine over the whole survey area, where you want to drill or
where to open up a dredge slit.
REFERENCES
[1] Bosshard M., June 2018, Sanierung Ufermauer Arbon, unpublished
Protokoll Nr., Projekt Nr. 3100-0761, Arbon, Wälli Ingenieure
[2] Meier E., Staubli P., Müller B. U., Stünzi J., Schubert E.,
Dubois D., Juli 2002, „Georadar - der zerstörungsfreie Blick in den
Untergrund: Beispiel aus dem Naturschutzgebiet Zigermoss, Unterägeri/ZG
und der Deponie Riet Winterthur/ZH“, Bulletin für angewandte Geologie,
Volume 7, Nr. 1, S. 31-44, Winterthur.
[3] Photo “Summerdays Arbon”
https://www.summerdays.ch/galerien/208/
[4] Photo “Eiswinter Arbon”
http://www.arbon-online.ch/eiswinter2012/IMG_5623.html
BIOGRAPHICAL NOTES
Edi Meier is currently the managing director of the
engineering company Edi Meier + Partner AG, Winterthur, Switzerland. He
studied Geophysics at the Swiss Federal Institut of Technology, ETH
Zurich. Subsequently he worked as a manufacturer of seismic instruments
(Streckeisen Switzerland) for six years and founded his own engineering
company in 1987. His company is specialized in development and
construction of precision deformation measuring systems and in
geophysical services using Geoelectric and Georadar (GPR) tools.
Inma Gutiérrez is a geologist and is currently
working at the engineering company Edi Meier + Partner AG, Winterthur,
Switzerland. She studied Geology at the University of Granada (Spain)
and completed a complementary Master in “Integrated water management” at
the University of Cádiz (Spain). After some experiences in the
geotechnical and water management branches, she is working since 2017 in
the geophysical branch, specializing in GPR.
Marco Baumann is currently working as a Senior
Expert in the Section Water Resources, Office for the Environment OEN,
Canton TG, in Frauenfeld, Switzerland. After his Ph.D. Thesis in 1986 at
the Geological Institute, Swiss Federal Institut of Technology, ETH
Zürich, he worked in various engineering companies as a Geotechnical and
Scientific Consultant and Projectmanager and as a Geologist,
Hydrogeologist, Projectmanager and Senior Consultat in a geology
company. Since 1st August 1994 he is working in the Office for the
Environment OEN, Canton TG. First as head of section Water Resources
with the topics of integral water management, hydrological data, water
protection and water use and since 1st January 2015 with the added
topics of Natural hazards, flood protection, river engineering and as
expert in the competence center for use of geothermal energy.
Max Bosshard studied civil engineering. After
graduating he worked as a research assistant at the Research Institute
for Hydraulic Engineering, Hydrology and Glaciology at the Swiss Federal
Institut of Technology, ETH Zurich. Subsequently, he joined as project
engineer some engineering companies in the Zurich area und worked in the
fields of tunneling, railway construction and hydraulic engineering.
Currently he is working at Wälli AG Ingenieure, Arbon, Switzerland. His
specialties at Wälli AG are constructions on the lake shore and in the
lake, such as port facilities, pipelines, footbridges and quay moorings
as well as river engineering and revitalization.
Rainer Heeb is a civil engineer FH. He
completed a postgraduate degree in business administration. Currently he
is the deputy head of the construction department of the city of Arbon,
Switzerland, and head of the civil engineering department.
CONTACTS
Edi Meier
Edi Meier + Partner AG
SWITZERLAND
Website: www.emp-winterthur.ch
Inma Gutiérrez
Edi Meier + Partner AG
Website: www.emp-winterthur.ch
Marco Baumann
Kanton Thurgau
Office fort he Environment
Website: www.umwelt.tg.ch
Max Bosshard
Wälli AG Ingenieure
Website: www.waelli.ch
Rainer Heeb
Stadt Arbon
Website: www.arbon.ch