Keywords: Darfield Earthquake, control, survey, geodetic
infrastructure
SUMMARY
On 4 September 2010 a magnitude ~7.1 earthquake struck 30 km west of
Christchurch near Darfield in the South Island of New Zealand. This was
the most damaging earthquake to affect New Zealand in almost 80 years.
The earthquake produced a ~30 km long surface rupture with up to 5 m of
horizontal displacement and 1 m of vertical movement. The shallow depth
of the earthquake produced some of the strongest ground shaking ever
recorded in New Zealand and resulted in areas of liquefaction and severe
ground damage locally.
The area affected by the earthquake consists of the flat alluvial
plans of Canterbury and includes the city of Christchurch and several
smaller surrounding towns. The rural area is highly developed with
peri-urban lifestyle blocks and intensive rural farming. The ground
deformation associated with the earthquake caused damage to utilities
such as water and sewerage, particularly in areas of liquefaction, and
has had a major impact on the cadastre, especially near the fault
rupture. Changes in levels have also raised concerns about the potential
hazard of increased flooding due to the low lying nature of the
topography.
The earthquake has also had a major impact on the geodetic
infrastructure used to fix the positions of cadastral boundaries,
utilities and flood management projects. Geodetic surveys were
undertaken immediately following the earthquake and in the subsequent
months to quantify the ground deformation caused by the earthquake, and
its impact on the geodetic and cadastral infrastructure in the area.
1. INTRODUCTION
1.1 Canterbury (Darfield) earthquake
The Canterbury region of New Zealand’s South Island experienced a
magnitude 7.1 earthquake on 4 September 2010. The earthquake was centred
near the town of Darfield, about 40km west of Christchurch, the South
Island’s main city (Fig. 1). Christchurch, with a population of 390,000,
is the second largest city in New Zealand. The Canterbury region
surrounding Christchurch is principally alluvial plains with small
townships as residential commuter towns for Christchurch or supporting
agricultural or horticultural activities on the Canterbury plains.
The depth of the earthquake was relatively shallow at about 10km. It
caused substantial damage to property and infrastructure, but no loss of
life. Across parts of Christchurch, liquefaction caused localised areas
of subsidence and lateral spreading. The earthquake occurred in an area
that has previously had few earthquakes relative to other parts of the
South Island. A fault rupture associated with the earthquake, named the
Greendale fault (Figs 1and 2), occurred along a previously unknown fault
and resulted in a surface rupture of several metres.
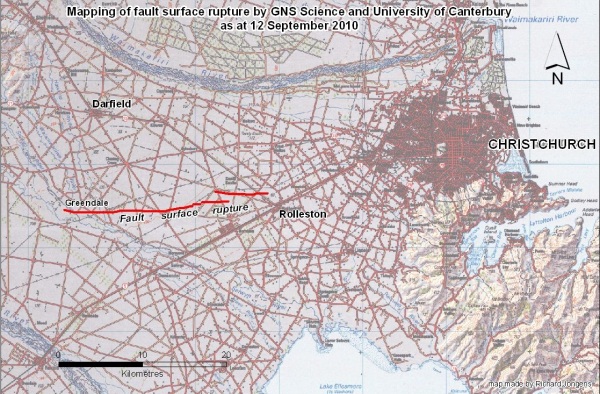
Figure 1. Location of Greendale fault relative to Christchurch City
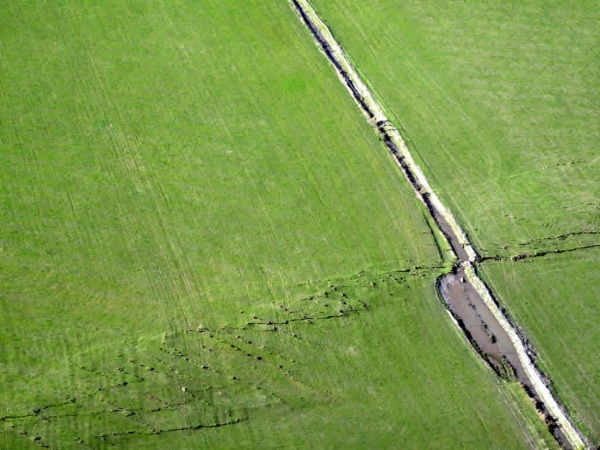
Figure 2. Trace of the Greendale fault displacing a water canal
1.2 The New Zealand Geodetic Infrastructure
New Zealand lies across the obliquely convergent Australian and
Pacific plate boundary. In addition to the plate motions, New Zealand
experiences the effects of other deformation events such as large
earthquakes, volcanic activity, and more localised effects such as
landslides.
To accommodate the effect of crustal motion, New Zealand implemented a
semi-dynamic datum, New Zealand Geodetic Datum 2000 (NZGD2000), in 1998
(Blick et al 2003). This datum includes a deformation model to convert
geodetic observations made at different times to a common reference
epoch of 1 January 2000 to accommodate the effect of crustal dynamics.
The impact of events such as the Darfield earthquake are managed using a
patch (Jordan et al., 2007) to ensure that the effects of the earthquake
can be modelled and the accuracy of the datum maintained.
The New Zealand Survey Control system is divided into a number of
networks, each of which serves a different purpose (Donnelly and Amos,
2010). LINZ also maintains a national continuously operating GNSS
network of 34 stations (CORS) which is used to monitor the dynamics of
New Zealand and provide real time positioning services to users.
New Zealand cadastral boundaries are defined by survey. For about 70%
of parcels, principally in urban and peri-urban areas, the cadastre is
connected to the geodetic network and is referred to as survey-accurate
– this could be termed a geodetic cadastre. Geodetic, cadastral and
title data are managed in an automated digital database called
Landonline. Landonline is an observational database that enables the
readjustment of coordinates as new or improved data comes to hand.
Since the introduction of NZGD2000 there have been substantial
earthquakes that have compromised the accuracy of the datum. However, to
date these earthquakes have been located in isolated parts of the
country, where population levels are so low that substantial efforts to
re-establish the control system have not been deemed necessary.
The Darfield earthquake changed this, centred as it was in a major
agricultural area near the city of Christchurch. Thousands of geodetic
marks and millions of cadastral marks are estimated to have moved by
significant amounts.
This article outlines the impact of the earthquake on the spatial
accuracy of the geodetic infrastructure and cadastre and the steps
proposed to update their accuracy.
2. PRE AND POST EARTHQUAKE SURVEYS
An extensive network of geodetic survey marks existed prior to the
earthquake across the Canterbury region. Donnelly et al 2011 provide
detailed descriptions of the surveys undertaken pre and post earthquake.
Pre-earthquake high accuracy survey data from the 1990s were
collected as part of the establishment of NZGD2000. A particularly dense
network of marks was available across Christchurch city. In addition,
one of the LINZ CORS stations operated close to Christchurch. These data
were supplemented by data collected from other agencies including
private surveyors.
An immediate post-earthquake survey was undertaken by GNS Science to
determine the extent and magnitude of co-seismic displacements. The data
were used to determine the initial extents of both horizontal and
vertical deformation associated with the earthquake. This and
differential InSAR data were used to determine a preliminary source
model for the earthquake (Beavan et al 2010). The results showed that
the deformation as a result of the earthquake was able to be well
modelled by displacement occurring on the strike-slip Greendale Fault
and several other fault segments (Fig. 3).
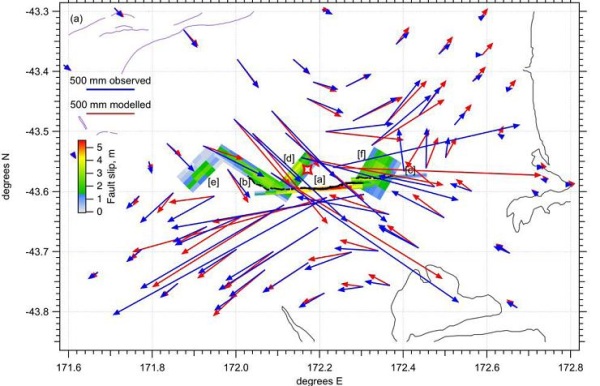
Figure 3a. GPS observed (blue) and modelled (red) horizontal
displacements. Black line shows the mapped extent of the Greendale fault
surface rupture. The coloured image shows the projection to the Earth’s
surface of the preliminary fault model. The model consists of slip on
the Greendale Fault plus three thrust segments on NE-orientated planes.
[From Beavan et al 2010]
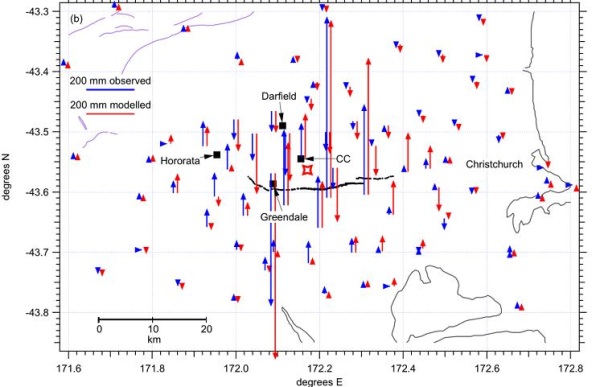
Figure 3b. GPS observed (blue) and modelled (red) vertical
displacements. [From Beavan et al 2010]
Once subsequent surveys confirmed that post-seismic movement was
subsiding, work commenced on more extensive surveys by LINZ to resurvey
190 marks which comprise the LINZ existing 1st-4th order networks across
the affected area. Control for this survey was provided by the marks
surveyed during the earlier deformation survey by GNS Science.
Displacements derived from this more extensive survey are shown in
Figure 4.
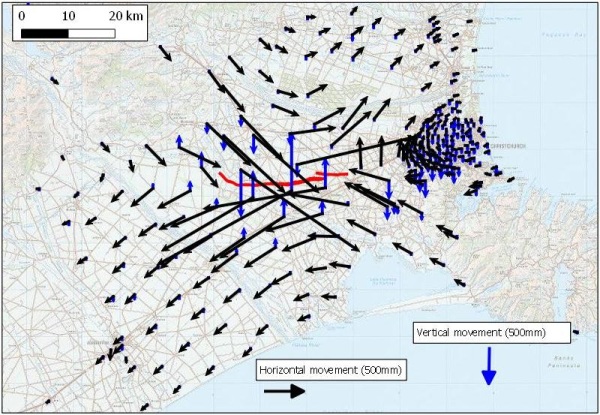
Figure 4: Horizontal (black vectors) and vertical (blue vectors)
displacements in Canterbury resulting from the Darfield earthquake
3. IMPACT ON THE GEODETIC SYSTEM
The survey results indicated significant displacements over a wide
area. Close to the Greendale fault, horizontal movements of over 2m and
vertical movements over a metre were measured. Across Christchurch the
movements showed a generally systematic pattern, but some marks showed
anomalous movements, both vertically and horizontally. These marks were
generally located in areas where localized mark disturbance was
suspected to have occurred due to liquefaction.
The numbers of geodetic and cadastral marks affected by ground
movements as a function of distance from the earthquake epicentre are
summarised in Table 1. Over a million geodetic and cadastral marks are
affected within 60km of the earthquake epicentre where significant
ground movements occurred.
Distance from Earthquake epicentre (km)
Geodetic marks (order 5 or better) Cadastral control (order 6 or better)
Total marks (geodetic and cadastral)
|
Distance from Earthquake
epicentre (km) |
Geodetic marks
(order 5 or better) |
Cadastral control (order 6 or
better) |
Total marks
(geodetic and cadastral) |
| 20 |
223 |
4816 |
56835 |
| 40 |
1492 |
54354 |
622727 |
| 60 |
4668 |
82986 |
1010333 |
| 80 |
5341 |
86667 |
1153926 |
| 100 |
5828 |
88849 |
1257921 |
Table 1: Number of geodetic and cadastral marks as a
function of distance from the earthquake epicentre
4. UPGRADING THE GEODETIC AND CADASTRAL NETWORKS
Resurveying the large number of geodetic and cadastral marks affected
by the Darfield earthquake is unrealistic and for the most part the
effect on mark coordinates can be derived from the updated deformation
model
The differences between the observed displacements and those
calculated from the early fault model are shown in Figure 5. The model
provided a good fit (except close to the Greendale fault and in
Christchurch) with residuals of a few centimetres. It is expected that
these could be reduced significantly by further refinement of the model,
and by empirically adjusting the calculated deformation in areas where
there is a clear systematic error in the modelled deformation. The model
could also be enhanced with additional survey data, in particular near
the fault.
Using the refined model it should be possible to account for most of
the displacement measured at the surveyed marks – it is expected that at
least 90% of the geodetic and cadastral marks could be spatially
upgraded using the displacement model. Adopting such an approach offers
some significant advantages:
- substantial cost reduction through upgrading the spatial
position of marks without resurveying a large number of marks
- quicker to re-establish spatial position of marks
- update geodetic and cadastral coordinates together
- update would all be done at once thus reducing confusion of
partially updated datasets
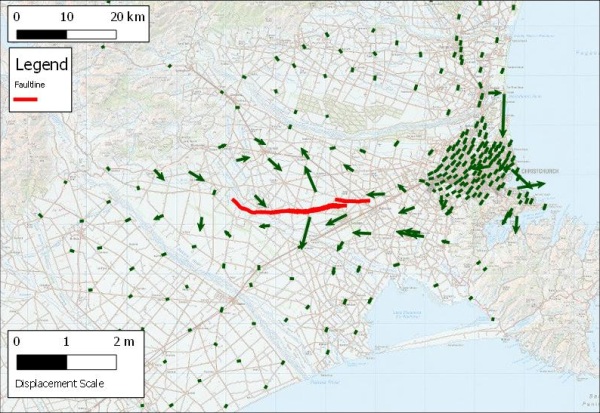
Figure 5: Residual displacements after observed displacements corrected
for displacement model
Areas close to the fault and areas of non-uniform deformation
(liquefaction) where the model did not fit would require additional
survey.
These plans were well advanced until a significant aftershock struck
Christchurch city on 22 February 2011.
5. EFFECT OF THE CHRISTCHURCH EARTHQUAKE
The Christchurch earthquake hit on 22 February 2011. Considered to be
an aftershock of the Darfield quake, it measured 6.3 on the Richter
scale. Although smaller in magnitude than the Darfield earthquake, its
location very close to Christchurch resulting in massive property damage
and loss of life. Particularly notable were the extensive areas of
liquefaction and ground damage (Fig. 6 and 7).
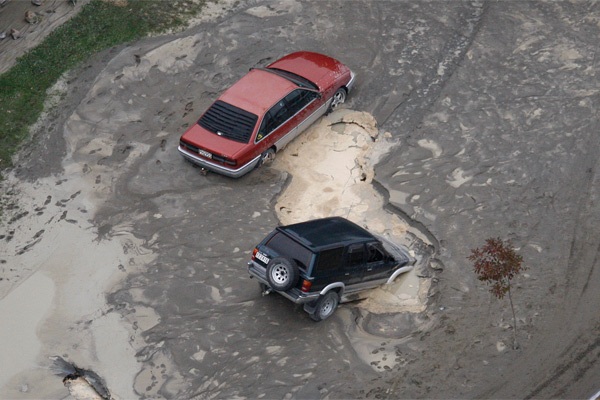
Figure 6: Area of liquefaction in Christchurch
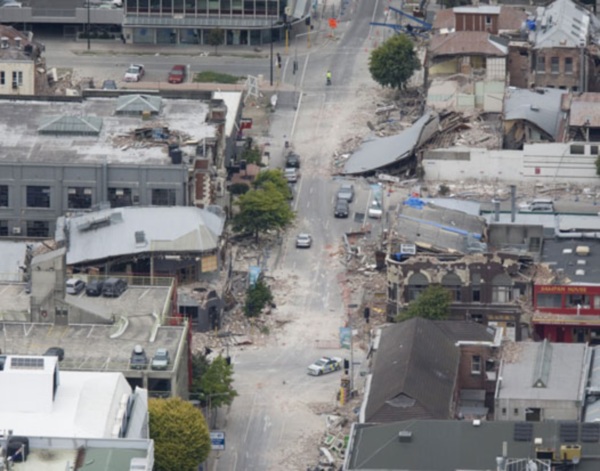
Figure 7: Damaged buildings in Christchurch
Following this event extensive surveys were again undertaken to
quantify the extent and magnitude of ground deformation. It was clear
that there were more extensive areas of non-uniform deformation and that
to use a displacement model to spatially correct positions of geodetic
and cadastral survey marks for this event would be more difficult.
At the time of writing this paper the use of a deformation model to
model this event is still being considered. However it is likely that it
will not be as successful as for the Darfield earthquake and more actual
resurvey of the geodetic and cadastral networks will be required in this
case.
6. CONCLUSIONS
The Darfield earthquake had a major impact on the geodetic and
cadastral infrastructure across the Canterbury region. A deformation
model has been developed that will be used to correct the spatial
position of perhaps 90% of geodetic and cadastral marks affected by the
earthquake. Areas close to the Greendale fault and where localised
liquefaction occurred will require further surveys to be undertaken to
correct for localised damage.
The effects of the more recent Christchurch earthquake may be more
difficult to model because of the more extensive localised ground damage
across Christchurch. Here, it is likely that more extensive surveys will
be required to correct for the effects of this smaller but more damaging
earthquake.
REFERENCES
- Beavan, J, Samsonov, S, Motagh, M, Wallace, L, Ellis, S and
Palmer, N, 2010, The Darfield (Canterbury) Earthquake: Geodetic
Observations and Preliminary Source Model, New Zealand Society for
Earthquake Engineering Bulletin, Vol 43, No 4, December 2010, pp
228-235.
- Blick, G, Crook, C, Grant, D and Beavan J, 2003, Implementation
of a Semi-Dynamic Datum for New Zealand. International Association
of Geodesy Symposia, A Window on the Future, Sapporo Japan.
Published by Springer, vol 128. 38-43
- Donnelly, N and Amos M, 2010, Implementation of a New Survey
Control Standard for New Zealand, in Proceedings of XXIV FIG
Congress, April 11-16, Sydney, Australia. Available at:
http://www.fig.net/srl/
- Donnelly, N, Ritchie, J, and Amos, M, 2011, Re-establishment of
the New Zealand Survey Control System following the 2010 Darfield
(Canterbury) Earthquake, in Proceedings of FIG Working Week, May
18-22, Marrakech, Morocco. Available at:
http://www.fig.net/srl/
- Jordan, A., Denys, P. and Blick, G. (2007) Implementing
localized deformation models into a semi-dynamic datum, IAG
Symposium Vol 130, Dynamic Planet, Cairns, Australia
BIOGRAPHICAL NOTES
Graeme Blick, Chief Geodesist, National Geodetic Office, Land
Information New Zealand
John Beavan, Crustal Dynamics Geophysicist, GNS Science
Chris Crook, Technical Leader, National Geodetic Office, Land
Information New Zealand
Nic Donnelly, Geodetic Surveyor, National Geodetic Office, Land
Information New Zealand
CONTACT
Graeme Blick
Land Information New Zealand
PO Box 5501
Wellington 6145
NEW ZEALAND
Tel. +64-4-498 3833
Fax + 64-4-498 3837
Email: gblick@linz.govt.nz
Web site: www.linz.govt.nz