Application of GPS Atmospheric Sounding for Climate
Studies in the Australian Region
Suelynn CHOY, Erjiang Frank
FU, John DAWSON, Minghai JIA
and Yuriy KULESHOV, Australia
Fabrice CHANE-MING, France Chuan-Sheng WANG
and Ta-Kang YEH, Taiwan
|

Suelynn Choy
|
1)
This paper was presented at the FIG Working Week in Sofia, Bulgaria,
17-21 May 2015. The paper presents results of analysis of atmospheric
characteristics (temperature and moisture) in the Australian region
using Global Navigation Satellite System (GNSS) ground-based meteorology
and space-based radio occultation (RO) techniques verified with in-situ
radiosonde measurement.
SUMMARY
This paper presents results of analysis of atmospheric
characteristics (temperature and moisture) in the Australian region
using Global Navigation Satellite System (GNSS) ground-based meteorology
and space-based radio occultation (RO) techniques verified with in-situ
radiosonde measurement. Ground-based GNSS and Global Positioning System
(GPS) meteorology has long offered the prospect of complementing
meteorological observations by providing integrated vertical column of
Precipitable Water Vapour (PWV) profiles. One of the most valuable
attributes of ground-based GPS-PWV is the ability to provide high
temporal and accurate PWV estimates under all weather conditions,
including cloud cover and precipitation. Here we present results of
deriving PWV using Australian ground-based GPS reference stations
network and investigate potential of using ground-based GPS technique
for measuring PWV. A good agreement of PWV estimates was found between
GPS and radiosonde measurements with a mean difference of less than 0.1
mm and standard deviation of 3.5 mm using five year of GPS data.
Space-based instruments provide wider (potentially global) coverage
than regional ground-based networks. One emerging satellite remote
sensing technique for obtaining atmospheric temperature and moisture
records is GPS RO which provides all-weather capability, long-term
measurement stability, high vertical resolution and high-accuracy
measurements in the middle to upper troposphere, stratosphere and
ionosphere. High accuracy of the GPS RO methodology is of particular
importance for reliable estimates of the atmospheric characteristics
over regions where conventional meteorological upper air observations
from radiosondes are sparse or not available. Here we present analysis
of vertical distribution of atmospheric temperature over data space
areas in the Australian region derived from GPS RO observations.
Detailed comparison between GPS RO and RS data over a five year period
demonstrated that temperature differences are <2°C in a range of
altitudes between 10 and 15 km.
1. INTRODUCTION
Conventional observations of atmospheric characteristics (temperature
and water vapour) are collected daily at thousands of meteorological
stations around the world, to be used for weather analysis and
forecasting. Subsequent statistical analysis of the archived data over
long-term period (decades and longer) allows derivation of plausible
conclusions about climate (average state of weather) based on
instrumental records obtained at ground-based and upper air
meteorological stations. Conventional observations are well established
and archives of meteorological variables recorded at many stations
worldwide go back for more than a century. Such continuity of records is
crucial for climate research, detection of historical trends in the
variables etc. However, conventional records are restricted to locations
of meteorological stations.
In modern time, data obtained by optical, infrared, radio- and
micro-wave remote sensing instruments revolutionised atmospheric
research as they provide potentially global coverage and consequently
improved access to areas which have limited number of meteorological
stations (data sparse areas). Remote sensing data complement
conventional observations and are widely used today in numerical weather
prediction, for climate monitoring and analysis adding value to and
improving skill of weather forecasts, accuracy of trend analysis of
meteorological variables etc (Bennitt
and Jupp, 2012, Boniface et al., 2009,
Means and Cayan, 2013, Yan
et al., 2009). It is of particular importance for meteorological and
climatological applications in the Southern Hemisphere where observation
stations are much less in numbers than in the Northern Hemisphere.
Global Satellite Navigation Systems (GNSS) such as the U.S. Global
Positioning System (GPS) technology has evolved and emerged as a
powerful atmospheric remote sensing tool for providing accurate
observations of atmospheric parameters. In this paper, we present
results of analysis of atmospheric characteristics in the Australian
region using the data obtained by ground- and space-based techniques,
which utilise radio signals of GPS. Rather than competing, these two
techniques are complementary.
Atmospheric water vapour is a critical component of the greenhouse
effect and plays a significant role in the global climate system. The
knowledge of the long-term spatial and temporal variability of water
vapour is vital for understanding climate change. Ground-based GPS has
long offered the prospect of complementing meteorological observations
by providing integrated vertical column of Precipitable Water Vapour
(PWV) estimates. One of the most valuable attributes of ground-based GPS
meteorology technique is the ability to provide high temporal and
accurate PWV estimates under all weather conditions, including cloud
cover and precipitation. Here we present results of PWV estimates using
data from the Australian ground-based GPS reference stations network to
investigate the prospect of using ground-based GPS meteorology technique
for monitoring PWV trends.
Space-based instruments provide even wider (potentially global) coverage
than regional ground-based networks. One emerging satellite remote
sensing technique for obtaining atmospheric temperature and moisture
records is GPS radio occultation (RO) which provides all-weather
capability, long-term measurement stability, high vertical resolution
and high-accuracy measurements in the middle to upper troposphere,
stratosphere and ionosphere (Heise
et al., 2008, Liou et al., 2007,
Pavelyev et al., 2013). High accuracy of the
GPS RO methodology is of particular importance for reliable estimates of
the atmospheric characteristics over the regions where conventional
meteorological upper air observations from radiosondes are sparse or not
available. Here we present analysis of vertical distribution of
atmospheric temperature over data space areas in the Australian region
derived from GPS RO observations.
2. GROUND-BASED GPS METEOROLOGY
GPS has long offered the prospect of retrieving column integrated PWV
profiles from the time-varying tropospheric Zenith Path Delay (ZPD),
which can be retrieved from GPS measurements. In 1992, Bevis et al. was
the first to devise innovative methods, now known as ground-based GPS
meteorology, for retrieving atmospheric water vapour profiles from the
GPS signals as they propagate through the atmosphere (Bevis
et al., 1992). Geodesists have, for a decade, treated the effects of
the atmosphere as noise parameters that need to be removed from the data
for the process of estimating positions. However, Bevis et al. (1992)
proposed that this delay could be parameterised in terms of a
time-varying total tropospheric delay. If surface temperature and
pressure observations at the GPS receiver are known to sufficient
accuracy, tropospheric delay can be converted into accurate estimates of
the total zenith column water vapour, termed PWV. Here, PWV means the
height of an equivalent column of liquid water (unit: mm).
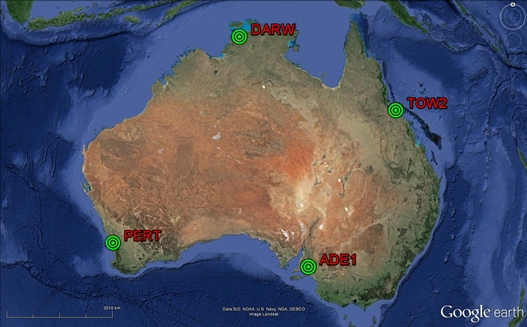
As a first step, we present a regional quantitative analysis of GPS-PWV
focusing on four Australian Regional GNSS Network (ARGN) stations (Geoscience
Australia, 2008) over a five-year period (2008 – 2012). The selected
four GPS sites sample quite different climate conditions across
Australia. DARW and ADE1 are located near 13° S and 35° S, respectively.
All GPS sites are located relatively close to the coast (see Figure 1).
These stations were selectively chosen to provide a representative
regional distribution of GPS sites with varying climates while ensuring
conventional meteorological observations such as surface-based data are
available for PWV conversion and other PWV sensors, e.g., upper-air data
from radiosondes, for validation purposes. The ARGN stations have been
built up progressively since the 1990s, which has the potential to
provide at least 15 years of GPS derived PWV estimates. The motivation
of this analysis work is to validate the computation strategy used to
process GPS data and conversion to PWV estimates given surface pressure
and temperature readings. The ultimate goal of this study is to use the
data to investigate seasonal variability and trends of PWV in Australia
and its implications for climate research and applications.
Figure 1: A Google Earth map showing locations of the four Australian
GNSS sites. ADE1-Adelaide, DARW-Darwin, PERT-Perth, TOW2-Townsville.
To validate the accuracy of the computed ZPD estimates, the values
were compared to the International GNSS Service (IGS) Final ZPD products
generated by United States Naval Observatory (USNO) (IGS,
2014). Table 1 shows the statistical results for the 2011 comparison
along with the number of records being compared (note that no GPS data
were recorded at ADE1 GPS station in 2011 and 2012.). The statistics
were computed based on the differences between our computed and the IGS
estimates. A comparison was made when there was a record and epoch match
that is no interpolation was made for comparison. Our ZPD estimates are
quite consistent to those of IGS with an average standard deviation of
3.8 mm, indicating that both techniques provide estimates of comparable
accuracy. This level of agreement aligns with previously published
results (Byram
and Hackman, 2012).
Table 1: Average differences (unit: mm) between the computed ZPD
estimates. Note that no GPS data were recorded at ADE1 in 2011.

2.1 Validation of GPS-PWV with Radiosonde Data
To convert the derived ZPD from GPS measurement to PWV, accurate
pressure and temperature readings are required. In this study, pressure
and temperature recordings from the nearest synoptic stations (within 50
km of the GPS site) were obtained from the Australian Bureau of
Meteorology (BOM) data archive. Gutman et al (2003) concluded that the
synoptic stations within 50 km of a GPS station could be used to derive
surface pressure at the GPS site with about 0.5 hPa bias. An error of
0.5 hPa in the pressure measurement will cause an error of 1 mm in the
estimated ZWD (Coster
et al., 1997), and subsequently an error in the PWV estimates of about
0.2 mm (Hagemann
et al., 2003).
Radiosondes are the primary operational source of upper air observations
including temperature, pressure and moisture. Radiosonde flights are
usually released twice a day (e.g. 11:00 UTC and 23:00 UTC). A
radiosonde flight ascends to 2 km in 7–8 minutes and reaches 5 km in
about 20 minutes after the launch. Although radiosondes can provide
meteorological observations with good vertical resolution, the temporal
and spatial variability of the GPS-PWV is not significant. However they
are a good source of independent validation data and are often used as a
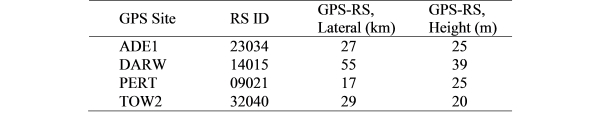
source of information for validating GPS-PWV datasets. The approximate
lateral distances and height differences between the GPS and radiosonde
sites are listed in Table 4.
Table 2: Approximate lateral distances (km) and height differences (m)
between the GPS and radiosonde (RS) sites.
Estimates of GPS derived PWV and radiosonde measurements of PWV were
compared over the 5-year period. Figure 2 shows a summary of comparison
for each year starting from 2008 to 2012. The mean values were computed
based on the average differences between radiosonde measurements of PWV
with GPS, i.e., ‘radiosonde minus GPS’. The mean difference is an
indication of systematic bias between the two instruments. In general,
the two instruments are in good agreement with a small mean difference
of less than 1 mm. TOW2 displays the largest mean bias of -1.5 mm
amongst the sites and the bias is fairly consistent across the five-year
period. A closer inspection of this site revealed significant changes in
the mean difference depending on the time of radiosonde launch, e.g.,
day/night differential behaviour. At 23 UTC (11 am local time), the mean
difference is -1.5 mm; while at 11 UTC (9 pm local time), the mean
difference is 0.9 mm. This may be a result of the dry biases in the
Vaisala instrumentation (Wang
et al., 2007). The larger dry bias during daytime is primarily caused by
the solar radiation heating of the humidity sensor (Vomel et al., 2007).
The standard deviation can be interpreted as the spread of the PWV
differences or variations from the mean. Sites showing relatively larger
standard deviations (> 3 mm) of PWV differences are stations located in
the northern part of Australia, such as DARW and TOW2, where atmospheric
moisture is the highest. The comparison statistics seem to also suggest
that the extent of the standard deviations of the PWV differences is
associated with the magnitude of PWV values. As the PWV estimates
increase in values, so do the standard deviations of the differences
between GPS and radiosonde PWV estimates. DARW and TOW2 sites show
similar characteristics. A mean difference between the GPS and
radiosonde PWV estimates over the 5-year period for all the sites is 0.1
mm with a standard deviation of 4.0 mm.
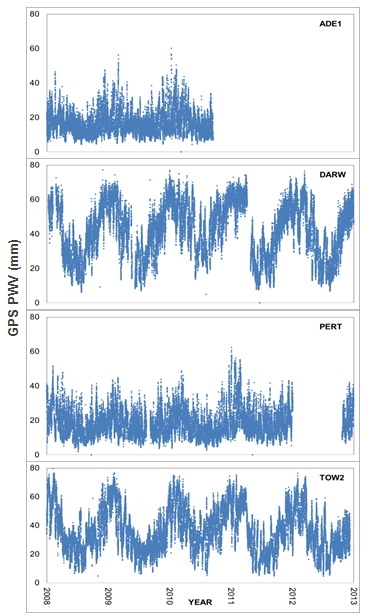
Figure 3 shows the 5-year absolute GPS-PWV estimates as time series. A
good agreement of PWV estimates was found between GPS and radiosonde
comparison with a mean difference of less than 0.1 mm and standard
deviation of 3.5 mm. It can also be seen that the spatial and temporal
variability of PWV concentration in the atmosphere depends on the
season, topography and other local/regional climate conditions. The time
series display strong annual variation in PWV at all sites, with
distinctive peaks (higher values) and dips (lower values) occurring
approximately in the austral summer and winter, respectively. The range
of PWV in Australia is between 0 mm to 80 mm. PWV values at stations
located in the northern part of Australia, e.g., DARW and TOW2, show
larger variation in PWV amplitude on the basis that warm air holds more
moisture and cold air is drier. The variation and magnitude of PWV is
typically less at higher latitudes; while the variation along the
longitude is not as significant as in the latitude. Detailed analysis of
these trends will be further conducted.
Figure 2: Comparison between radiosonde measurements of PWV (mm) and
GPS.
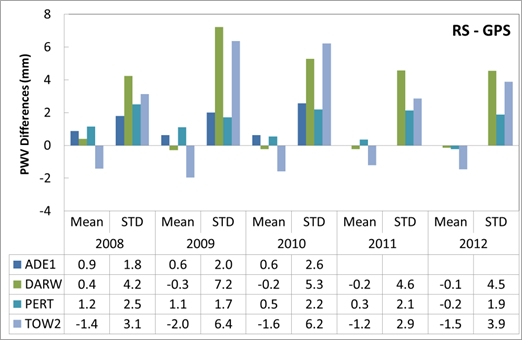
Figure 3: PWV estimates from 2008 – 2013 at ADE1, DARW, PERT and
TOW2 GPS stations. The Y-axis denotes GPS derived PWV (mm) and the
X-axis denotes the year.
3. GPS RADIO OCCULTATION
The Australasian region is highly important in terms of impacts on
weather and climate of the Earth yet it is not sufficiently covered by
meteorological observations. The region is significant in meteorology
because it is considered the most important energy source region in the
entire global circulation system owing to a number of coincident
factors. The most significant being geographic location and topography,
both of which contribute to the development of the warmest large area of
ocean on Earth, the Tropical Warm Pool. This is a region of intensive
ocean/atmosphere interaction with widespread convection and environment
favourable for Tropical Cyclone (TC) development. El Niño–Southern
Oscillation (ENSO), a coupled ocean-atmosphere phenomenon in the central
Pacific, is another significant climate driver of the planet, which
causes extreme weather (such as floods and droughts) in many regions of
the world. Consequently, accurate knowledge about state of the
atmosphere over the Pacific Oceans are vital for understanding the ENSO
and their impacts on climate of the Australasian and other regions of
the planet.
To analyse the state of the atmosphere in this region, we used GPS RO
data from FORMOSAT-3/COSMIC (F3C) mission. F3C is the first GPS RO
mission that employs a satellite constellation for RO observations and
the constellation consists of six Low Earth Orbit satellites (Liou et al., 2007,
Pavelyev et al., 2007). F3C was launched in
2006 and the constellation is currently operational providing a large
number of daily observations. GPS RO data from F3C constellation were
obtained from COSMIC web site http://www.cosmic.ucar.edu/. We analysed
GPS RO temperature and moisture profiles obtained by F3C constellation
over the continent of Australia and nearby oceans.
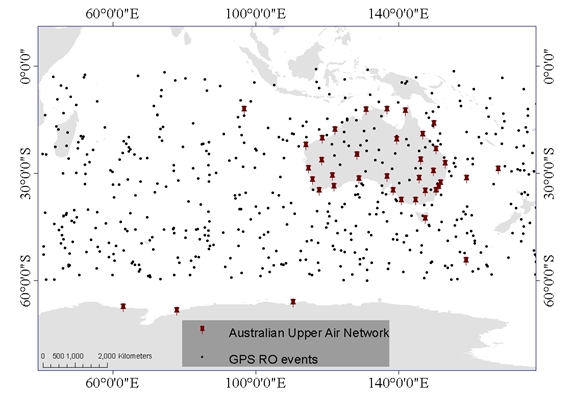
The left plot in Figure 4 shows the location of the Australian region
radiosonde sites, and the right plot shows a daily sample of GPS RO
events. On average, the Australian region obtains around 300 RO events
daily which is more than a number of atmospheric profiles that the
radiosonde stations could provide. Verification of GPS RO atmospheric
profiles using RS data has been conducted in a number of studies for
various regions (Fu
et al., 2007, Kuo et al., 2005).
Figure 4: Locations of the Australian upper air radiosonde stations and
a daily sample of GPS RO events over the Australian region.
We compared F3C RO temperature profiles obtained over the Australian
continent and Pacific Ocean with RS data. Data from three selected
stations were identified, i.e., Darwin, Townsville and Nouméa. Five
years of RS data (2006-2010) have been compared with GPS RO events
selected to satisfy criteria of (i) spatial collocation to be within 300
km radius from geographic position of the meteorological site, and (ii)
temporal collocation to be less than 3 hours before or after the time of
RS launch. The number of compared profiles was similar for RS and GPS RO
events at almost all sites and was approximately evenly distributed
between TC seasons (November to April) and non-TC seasons (May to
October).
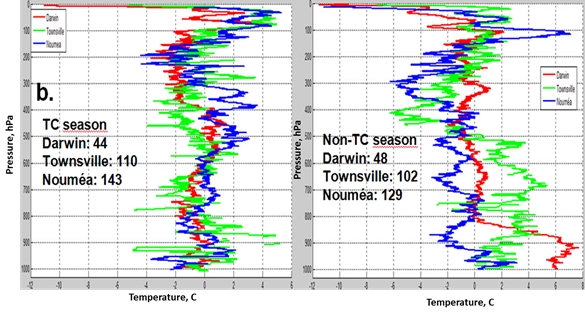
Tropical air over the Australian region is generally warm and moist.
However, there is a distinct seasonality. We stratified the observations
between TC seasons (November to April) and non-TC seasons (May to
October). In the Southern Hemisphere, November to April is a wet season
and May to October is a dry season; this is translated into significant
difference in distribution of atmospheric moisture and temperature. The
number of profiles was approximately evenly distributed between TC and
non-TC seasons. Good agreement between GPS RO and RS temperature
profiles has been found at all stations, especially in the lower
stratosphere and the upper troposphere (Figure 5). Detailed comparison
between GPS RO and RS data demonstrated that temperature differences are
<2°C in a range of altitudes between 10 and 15 km.
Figure 5: Comparison between RS and GPS RO profiles during the Southern
Hemisphere TC season (November to April, left) and non-TC season (May to
October, right). The Y-axis denotes pressure in hectopascal (hPa) and
the X-axis denotes temperature in degrees Celsius (C).
The success of GPS has encouraged further development of GNSS systems.
GLONASS (Russian Federation) is another currently operational satellite
positioning system. The system has 24 satellites in orbit. Countries of
the European Union proposed their own GNSS system (Galileo) and it has
been designed as a service-oriented positioning system. Six operational
satellites are currently in orbit and full completion of the
30-satellite Galileo system is expected by 2020. The QZSS system is a
Japanese regional augmentation system and will have three additional
satellites by 2018. The first QZS-1 was launched in 2010. The QZSS
satellites will fly over Japan, Eastern Asian and the Australian regions
and will provide better opportunities of utilising GNSS RO for these
regions. China has launched 16 BeiDou satellites (as of August 2014) to
establish its own GNSS system. The Chinese system will have 35
satellites in total in different earth orbits to provide a global
coverage. It has great potential and will be considered for our future
research on application to climate studies in the Australian region.
We analysed the number and distributions of the RO events in the
Australian region from F3C and its successor, FORMOSAT-7/COSMIC-2
constellations with multiple GNSS systems (i.e. GPS, GLONASS, Galileo
and QZSS). Over 3,000 daily atmospheric profiles in the Australian
region can be expected from the FORMOSAT-7/COSMIC-2 constellation after
launch of six satellites in low-inclination orbits planned for 2015 and
another six satellites into high inclination orbits in 2018. The largest
increase in a number of RO events is expected between the equator and 30
degrees latitude (North and South), which will significantly contribute
to enhancement of TC research and observations.
4. CONCLUSION
In this paper on recent progress in advancing climate studies in the
Australian region we demonstrated that GPS satellites and ground-based
measurements are valuable data source of meteorological parameters. We
presented examples of analysis of distribution of atmospheric
temperature over the continent of Australia and the Pacific Ocean from
GPS RO observations and noted high accuracy of remote sensing data
verified using conventional RS measurements. We also evaluated potential
of the Australian regional network of GPS stations to estimate
atmospheric water vapour content. The study demonstrated that
GPS-derived PWV values are of high accuracy and could be used for
long-term regional reanalysis of the Australian climate. In the future,
with further expansion of GNSS system, it is expected that GPS
satellite- and ground-based measurements even further advance studies on
climate analysis and monitoring.
Ground-based GPS meteorology and space-based RO techniques have been
recognised as an emerging technique for Earth’s atmospheric observation.
Atmospheric temperature profiles derived from GNSS RO observations
provide valuable information about state of the atmosphere over the
oceans where upper air data from conventional meteorological
observations are particularly scarce. With the recent GPS modernisation
and new global and regional GNSS systems in the near future, next
generation RO missions will have opportunity and capability to utilise
signals from more than a hundred of GNSS satellites. Thus, the
resolution, quantity and quality of the GNSS RO observations will be
improved significantly and the data will have significant impact on
improving accuracy of weather forecasting and climate studies.
Similarly, analysis of long-term data from GPS ground-based stations
(e.g. the Australian regional GNSS network) will provide accurate
estimates of variability and trends in atmospheric moisture, which in
turn will improve our understanding of the regional climate processes.
ACKNOWLEDGEMENT
This work was partially supported by the RMIT Foundation and the Malcolm
Moore Industry Research Grant. The authors would also like to thank the
two anonymous reviewers for their helpful suggestions to improve the
manuscript.
REFERENCES
BENNITT, G. V. & JUPP, A. 2012. Operational Assimilation of GPS Zenith
Total Delay Observations into the Met Office Numerical Weather
Prediction Models. Monthly Weather Review, 140, 2706-2719.
BEVIS, M., BUSINGER, S., HERRING, T. A., ROCKEN, C., ANTHES, R. A. &
WARE, R. H. 1992. GPS Meteorology: Remote Sensing of Atmospheric Water
Vapor Using the Global Positioning System. Journal of Geophysical
Research, 99, 787-801.
BONIFACE, K., DUCROCQ, V., JAUBERT, G., YAN, X., BROUSSEAU, P., MASSON,
F., CHAMPOLLION, C., CHERY, J. & DOERFLINGER, E. 2009. Impact of
high-resolution data assimilation of GPS zenith delay on Mediterranean
heavy rainfall forecasting. Annales Geophysicae, 27, 2739-2753.
BYRAM, S. M. & HACKMAN, C. Troposphere Product by the USNO. IGS
Workshop, 23-27 July 2012 Olsztyn, Poland.
COSTER, A. J., NIELL, A. E., SOLHEIM, F. S., MENDES, V. B., TOOR, P. C.
& LANGLEY, R. B. The Effect of Gradients in the GPS Estimation of
Tropospheric Water Vapor. The ION 53rd Annual Meeting, 30 June - 1
July 1997 Albuquerque, New Mexico.
FU, E., ZHANG, K., WU, X., MARION, K. & REA, A. 2007. An evaluation of
GNSS radio occultation technology for Australian meteorology. Journal of
Global Positioning System, 6, 74-79.
GEOSCIENCE AUSTRALIA. 2008. Australian Regional GPS Network [Online].
Available:
http://www.ga.gov.au/geodesy/argn/ [Accessed January 2008].
GUTMAN, S. I., SAHM, S. R., STEWART, J., BENJAMIN, S., SMITH, T. &
SCHWARTZ, B. A new composite observing system strategy for ground-based
GPS meteorology. the 12th Symposium on Meteorological Observations
and Instrumentation, AMS, 2003 Long Beach, CA.
HAGEMANN, S., BENGTSSON, L. & GENDT, G. 2003. On the Determination of
Atmospheric Water Vapor from GPS Measurements. Journal of Geophysical
Research, 108, 4678.
HEISE, S., WICKERT, J., BEYERLE, G., SCHMIDT, T., SMIT, H., CAMMAS,
J.-P. & ROTHACHER, M. 2008. Comparision of Water Vapor and Temperature
Results from GPS Radio Occultation Aboard CHAMP with
MOZAIC Aircraft
Measurements. IEEE Transactions of Geoscience and Remote Sensing, 46,
3406 – 3411.
IGS. 2014. International GNSS Service [Online]. Available:
http://igscb.jpl.nasa.gov/
[Accessed January 2014].
KUO, Y. H., SCHREINER, W. S., WANG, J., ROSSITER, D. L. & ZHANG, Y.
2005. Comparison of GPS radio occultation soundings with radiosondes.
Geophysical Research Letters, 32.
LIOU, Y. A., PAVELYEV, A. G., LIU, S. F., PAVELYEV, A. A., YEN, N.,
FLUANG, C. Y. & FONG, C. J. 2007. FORMOS AT-3/COSMIC GPS radio
occultation mission: Preliminary results. Ieee Transactions on
Geoscience and Remote Sensing, 45, 3813-3826.
MEANS, J. D. & CAYAN, D. 2013. Precipitable Water from GPS Zenith Delays
Using North American Regional Reanalysis Meteorology. Journal of
Atmospheric and Oceanic Technology, 30, 485-495.
PAVELYEV, A. G., LIOU, Y. A., WICKERT, J., SCHMIDT, T., PAVELYEV, A. A.
& LIU, S. F. 2007. Effects of the ionosphere and solar activity on radio
occultation signals: Application to CHAllenging Minisatellite Payload
satellite observations. Journal of Geophysical Research-Space Physics,
112.
PAVELYEV, A. G., ZHANG, K. F., LIOU, Y. A., PAVELYEV, A. A., WANG, C.
S., WICKERT, J., SCHMIDT, T. & KULESHOV, Y. 2013. Principle of Locality
and Analysis of Radio Occultation Data. Ieee Transactions on Geoscience
and Remote Sensing, 51, 3240-3249.
VOMEL, H., SELKIRK, H., MILOSHEVICH, L., VALVERDE-CANOSSA, J., VALDES,
J., KYRO, E., KIVI, R., STOLZ, W., PENG, G. & DIAZ, J. A. 2007.
Radiation dry bias of the vaisala RS92 humidity sensor. Journal of
Atmospheric and Oceanic Technology, 24, 953-963.
WANG, J. H., ZHANG, L. Y., DAI, A., VAN HOVE, T. & VAN BAELEN, J. 2007.
A near-global, 2-hourly data set of atmospheric precipitable water from
ground-based GPS measurements. Journal of Geophysical
Research-Atmospheres, 112.
YAN, X., DUCROCQ, V., POLI, P., HAKAM, M., JAUBERT, G. & WALPERSDORF, A.
2009. Impact of GPS zenith delay assimilation on convective-scale
prediction of Mediterranean heavy rainfall. Journal of Geophysical
Research-Atmospheres, 114.
CONTACTS
Dr. Suelynn Choy
School of Mathematical and Geospatial Sciences
RMIT University
GPO BOX 2746V
Melbourne 3001
AUSTRALIA
Tel. +61 3 9925 2650
Fax +61 3 9663 2517
Email:
suelynn.choy[at]rmit.edu.au
|


