The Impact of a New Subway Line on Property Values in
Helsinki Metropolitan Area
Juhana HIIRONEN, Kirsikka
RIEKKINEN
and Hanna TUOMINEN, Finland
1)
This paper was presented at the FIG Working Week in Sofia, Bulgaria,
17-21 May 2015. This paper illiminates whether a new subway line will
have an impact on residential apartment values and on public revenues.
SUMMARY
The planning process of a new subway line started in 2007 in the
Helsinki metropolitan area. The construction works were started in 2009
and the new subway line is planned to be opened by the end of 2015. As a
result of the new subway line the travelling time to the city center
decreases. The prediction of economic theory would be that housing
prices near the subway stations would increase as a result of having
better access and lower cost of traveling within the city. The empirical
evidence on these predictions is however missing, at least in Finland.
The objective of this article is to illuminate whether this new
subway line will have an impact on residential apartment values and on
public revenues. The research questions are: how far does the effect of
a new subway line reach (Q1); how big (%) is the average impact on
apartment values (Q2) and; how big (€) is the total impact on apartment
values (Q3). The article also discusses how the rail-induced value
increases effect public revenues. The first question was analyzed and
answered based on literature review. The second question was analyzed
based on hedonic approach. The third question was answered based on the
two previous questions.
The results showed that a new subway station has an impact that
reaches in most surroundings at least to 400 meters. The impact that the
new subway station had on residential apartment values was on average
11-15 percent in the studied area. The total impact in the studied area
was approximately 122-193 million euros. It was estimated that the
rail-induced value impact increased the city’s revenues from property
taxes for almost 10 percent.
1 INTRODUCTION
The planning process of a new subway line started in 2007 in the
Helsinki metropolitan area. The construction works begun in 2009. The
new subway line is planned to be opened by the end of 2015. This study
analyzes the value impact that the new subway line will have on one
residential area. The case area called Matinkylä will have its own
subway station by the end of 2015. Whether this new subway line will
have an impact on apartment values and further more on public revenues
is a question that will be illuminated in this article.
The prediction of economic theory would be that housing prices near
the subway stations would increase as a result of having better access
and lower cost of traveling within the city (Alonso 1968, p. 59; Mills
1967, p. 200; Muth 1970, p. 5-6). As a result of the new subway line the
travelling time to the city center decreases. The decreased travelling
time increases the wellbeing of the community which causes growth in the
prices of residential apartments. The prices will keep increasing
because of the higher demand until the wellbeing has been restored to
its previous level due to the increased living expenses. The empirical
evidence on these predictions is however missing, at least in Finland.
As regards funding for public transit, one should point out that
possible public-transit induced premium on sales of residential
apartments generates additional revenue from property taxes. This effect
of public transport has been largely filtered out in the discussion of
funding for public transit, which might be due to the lack of empirical
evidence so far regarding the influence of rail infrastructure on house
prices in Finland. This study is to help to close this gap by analyzing
the contribution of rail-induced price increases to the funding of
public transport.
Therefore the effect of the new subway line in the Helsinki
metropolitan area becomes an empirical question. The goal of this study
is to estimate is there such an impact. The research question regarding
property prices is divided in three sub-questions:
- How far (meters) does the effect of a new subway line reach
(Q1)?
- How big (%) is the average impact (Q2)?
- How big (€) is the total impact (Q3)?
The average impact means the percentage increase of real estate value
and total impact the absolute increase of real estate value. The first
question is analyzed and answered based on a literature review. The
second question is analyzed based on a hedonic approach. The third
question will be answered based on the two previous questions. The
contribution of rail-induced price increases will be analyzed and
discussed based on the third question.
The study contributes to an understanding of the hitherto little
explored influence of income level on the connection between access to
railway infrastructure and residential apartment prices. Literature
review section provides an overview of the current literature on the
subject. Materials and methods section describes the data that forms the
basis of the study and illustrates the empirical models used. In the
Results section the answers to the research questions are given based on
the material and methods used. Discussion and conclusions are presented
in last section.
2 LITERATURE REVIEW
There are two main questions that need to be reviewed when the total
impact of a new subway line is analyzed. The first question is how far
the impacts (positive or negative) reach. The second question is how
strong the impact in the chosen or revealed area is.
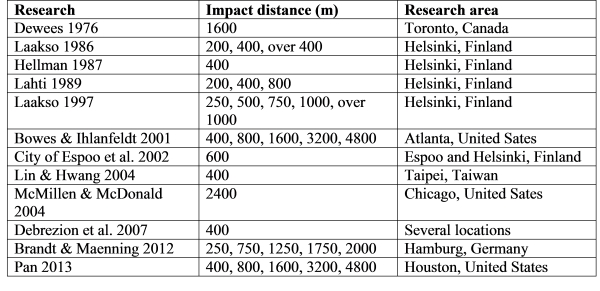
The reach of the impact of a subway station has been analyzed in
several studies. The studies show that the impact on property values can
reach for almost five kilometers away (see Table 1). According to Dewees
(1976) the impact area reaches to 1600 meters. McMillen and McDonald
(2004) discovered that the impact reaches up to 2400 meters. Bowes and
Ihanfeldt (2001, p. 15-18) show that the impact to the price is negative
when located close to a subway station, but after 400 meters the impact
turns positive. Brandt and Manning (2012, p. 1009-1011) estimated that
the impact is the biggest when reaching a distance of 250 to 750 meters
from a station. In every study that was reviewed in this study the
impact area reached at least to 400 meters. This distance is considered
to be the minimum distance for which the new subway station has at least
impact. The different values in one row are those limits, where the
impact changes.
Table 1. Previous research on impact areas of subway.
When reviewing the previous studies, it has to be noted that in this
case area the subway line is built to an area with no existing subway
lines. This will most probably have an effect on how far the effect of
the new subway line reach. If the research area has already several
existing subway lines, the impact area of a new line may be smaller
because the density of the stations is bigger and due to that, they
collect less people from the surrounding area. Table 2 presents the
existence of subway lines in the research areas of the previous
researches. Based on the background information of the previous
researches, the most similar areas compared to the studied area are
those which concern the new subway line in Espoo (Lahti 1989; City of
Espoo et al. 2002), the Helsinki subway (Laakso 1997), the Toronto
subway (Dewees 1976) and Chicago subway (McMillen & McDonald 2004). In
these studies the impact reaches from 600 meters to 2400 meters. The
City of Espoo et al. (2002) examined the impact of the new subway line
and found it to be 600 meters on average from each subway station. As
the subway in the case area is being built in the City of Espoo, the
estimate from last source can be seen as the most reliable one.
Table 2. The existing subway lines in the previous research areas.
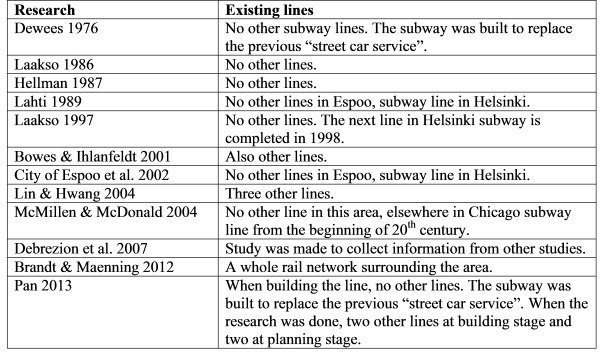
When building the line, no other lines. The subway was built to
replace the previous “street car service”. When the research was done,
two other lines at building stage and two at planning stage.
Based on the previous studies it can be stated that the impacts of a
subway station reach almost certain to a distance of 400 meters. This is
the minimum distance used in this study. The maximum distance chosen for
this study is 800 meters since the density of stations of the new line
is rather large. By choosing the maximum distance of impact to be 800
meters, the goal is to avoid overlapping estimation of impacts of
several stations.
The previous Finnish studies show that the impact of building a
subway has only positive effects. The price increases of residential
properties near the subway station (< 400 m) varied from 7,5 to 16
percent (Laakso 1997; Laakso 1991; Laakso 1986). More variance can be
detected in international studies where the impact near the subway
stations varies from – 18,7 to 33 percent. The property value impacts
form the reviewed articles are presented in Table 3.
Table 3. The change in prices of residential properties.
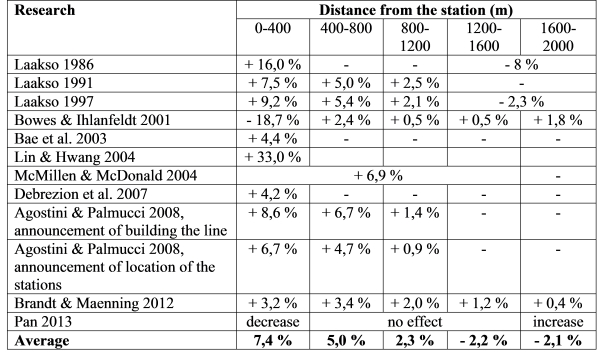
The international studies show that the impacts of a metro station to
the prices of residential properties vary strongly. A study made by
Bowes and Ihlanfeldt (2001) reveals also a negative impact when
examining the close surroundings of a metro station. A possible
explanation for this may be that this particular study takes also the
crime statistics into account. Overall, the variation in impact areas
between different studies can be explained by variation in research data
and methodology. Each of the studies needs to be carefully revised when
comparing the impact areas.
3 MATERIALS AND METHODS
3.1 Study material
3.1.1 Apartment prices
Apartments are classified as private properties in the Finnish
legislation. The Finnish purchase price register has information only
concerning real property transactions. Only the Finnish tax officials
have the full information on realized prices form apartment transactions
and this information is not available, even for research purposes. The
Finnish realtors have, however, their own price register on apartment
prices which they publish online (www.asuntojen.hintatiedot.fi). The
information is available only from the past 12 months. Transactions are
presented only if there are three or more transactions in the same
postcode. Only the major realtors are publishing transactions. These
restrictions mean that on average, approximately half of the
transactions are listed in this online price register. (Tuominen 2014,
p. 37-39). Information that is this price register include: transaction
price, postcode, number of bedrooms, area, construction year, floor,
elevator (yes/no), balcony or yard (yes/no) and condition
(poor/satisfactory/good).
Information for this study was collected from the mentioned price
register in 21st February 2014. Transactions were selected from two
cities, Helsinki and Espoo. Total 3 431 transaction were found and 11
from those were eliminated because they were most likely parking slots
or similar utilities inside apartment buildings. Transactions were made
in 177 different postcode areas. The construction years varied from
1 874 to 2 015. 5 percent of the apartments were in poor condition, 41
percent in satisfactory condition and 54 percent in good condition. 60
percent of the apartments had an elevator and 25 percent a balcony or a
yard. The floors varied from 1 to 17 and the number of bedrooms from 1
to 4 (or bigger). The average price per square meter was 4 234 €.
Also an additional variable regarding travelling time to central
business district (CBD) was added to the study material. The travelling
time to CDB was defined by using the official route calculator (www.reittiopas.fi)
that analyses travelling time (minutes) with the chosen transportation.
Finally, the material was coded for hedonic approach.
3.1.2 Apartments
The information about apartments and their characteristics itself is
widely available. In this study a public database (SeutuCD) was utilized
to collect the information about apartment characteristics on the
residential area (Matinkylä) that was chosen as the case area. By
utilizing the answers to Q1, represented in Literature review, the
information about apartment characteristics was collected. Figure 1
shows the study area and illustrates the surroundings on different
distances (400 meters, 800 meters).
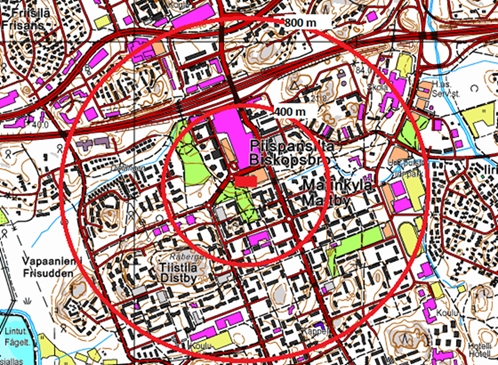
Figure 1: Matinkylä resindential area. The information about
apartment characteristics was collected by using two radius (either 400
or 800 metres) around the new subway station.
Inside 400 meter radius there were 77 apartment houses and inside 800
meter radius 561 apartment houses. The age of the apartment houses
varied from 1 to 55 years, average being 25.
Following information was collected concerning each apartment inside
an apartment house: age, number of bedrooms and size of the apartment.
Also two additional variables regarding travelling time to CBD were
added to the study material. First of all, the current travelling time
was added by utilizing the official route calculator. Then the future
travelling time (after the subway is built) was added. This was done by
calculating the travelling time as a sum of the time spent on the way to
the subway station and on the subway itself. The route calculator was
utilized to estimate the time spent between each apartment and the
subway station and the timetables of the new subway (published already!)
to estimate the time spent in the subway.
3.2 Methodology
The average price impact (Q2) is calculated with hedonic price
functions. Econometrically, hedonic price models are estimated with the
Ordinary Least Squares (OLS)
method. The idea of hedonic pricing is to consider housing as a
multi-dimensional differentiated good. Hedonic equations are used to
decompose housing rent or value into measurable prices and quantities
that can be used to estimate rents or values of different dwelling
combinations. A hedonic estimation is simply a regression of
expenditures on the housing characteristics. The regression coefficients
may be transferred into implicit price estimates of these
characteristics.
There are many features affecting housing prices, the most common
categories being structural, neighborhood and locational
characteristics. Malpezzi (2003) presents the fundamental hedonic
equation simply as follows [1]:
P = f(S, N, L, C, T), where:
P = price / value of the dwelling, S = structural characteristics, N =
neighborhood characteristics, L = location, C = contract conditions or
characteristics, and T = the time rent or value is observed.
There is no such thing as an established functional hedonic form in
the literature of urban economics (see e.g. Halvorsen and Pollakowski
1981, Malpezzi 2003). Pioneering papers on hedonic analysis like
Lancaster (1966) and Rosen (1974) provide little help for choosing the
functional form. One of the most important findings of the hedonic
pricing theory is the nonlinearity of the value function (Laakso 1997).
Nonlinearity stems from the non-divisibility feature of housing. In
practice, the nonlinearity is taken into account by using the natural
logarithm of price as the dependent variables.
Different authors have tried different models to find the best fit.
For instance, in his literature review on empirical studies on housing
prices, rents and land prices, Laakso (1997) concludes that the most
common functional forms are log-linear and semi-log forms. Flexible
functional forms and the Box-Cox transformation are also common. Laakso
concludes that when the size of the data set allows the use of dummy
variables, dummy variable models are superior as compared with
continuous variable models regarding R2 statistics and homoscedasticity.
Furthermore, the results of dummy models are simple to interpret. After
having reviewed a number of hedonic pricing studies, Sirmans et al.
(2005) conclude that linear and semi-logarithmic specifications are the
most common ones.
In this study, the data was analyzed using the ordinary least squares
method. The general form of the linear regression model is as follows [2]:

where β0 is the intercept, β1–n measure the change in y with respect
to x1–n, while holding all other factors fixed, and u is the error term.
The estimated equation expresses the price per square meter as a
function of the independent variables. An attempt was made to take a
natural logarithm of the unit price, but the linear form was found to be
a better fit.
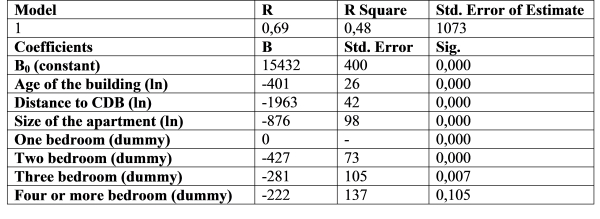
After a number of iteration, the best equation that could be formed
based on the data available is presented in Table 4. As seen in Table 4,
only four variables were found statistically significant (at 1 percent
level). The variables that were not included in the model were: floor,
elevator (dummy), balcony (dummy), condition, municipality, and distance
by private car. Even the condition of the apartment could not be
included to the model because of its strong correlation between the ages
of the buildings as was the correlation between distance by private car
and distance to CBD. The model accounted for 48 percent (R2) of the
variance in the apartment prices which is not very good comparing price
models in general. But in this case where the data is limited it was the
best achievable result. The result could have been better if some
proportion of the observations that didn’t fit the model had been
eliminated from the study material. But as we had no other evidence than
the price to conclude if the observation was representative, practically
all of the observations were included in the analyses.
Table 4: The hedonic model from apartment transactions in Helsinki
metropolitan area between 22.2.1013
The model presented in Table 4 is used to analyze the answers to Q2
and Q3. For Q3, the formula is used to calculate a value estimate for
every apartment in the study areas (400 meter, 800 meter), both before
and after the new subway station is in use. The difference between these
two values in both areas is considered to give an answer to the question
how big (€) is the total impact (Q3). When the total impact is divided
among single apartments, an estimate on how big (%) is the average
impact (Q2) can be given.
If we would like to give an estimate for an expected price change for
a single 80 square meter apartment that is built in 1967 (age 48), has 3
bedrooms and has now 35 minutes distance to CDB and afterwards 30
minutes distance to CDB, the formula can be formed as:
Price (before) = 15432 – 401 x ln(48) – 1963 x ln(35) – 876 x ln(80) –
282 x 1 = 2780 €/m2
80 meters x 2780 €/m2 = 222 400 €
Price (after) = 15432 – 401 x ln(48) – 1963 x ln(30) – 876 x ln(80) –
282 x 1 = 3082 €/m2
80 meters x 3082 €/m2 = 246 600 €
In this case the total impact would be 24 200 € and the average impact
11 percent.
To analyze the impact on public revenues the total impact (Q3) is
multiplied with annual property tax (0,8 percent) and capitalized to 30
years with 5 percent interest rate. This discount rate and time period
was chosen because they are generally used for cost-benefit analyses in
public investment projects in Finland.
4 RESULTS
This study was set up to analyze the impact that the new subway line
has on apartment prices and on public revenues. In the literature review
it was observed that a new subway station has an impact that reaches in
most surroundings at least to 400 meters. In the studied area, the reach
of the impact regarding property prices was estimated to be somewhere
between 400 and 800 meters. In the studied area other subway stations
are located quite close to each other and after 800 meters it is
difficult to estimate which station “makes” the impact.
The impact that the new subway station has on residential apartment
prices is on average 15 percent in 0-400 meter radius and 11 percent in
0-800 meter radius. The total impact in the studied residential area
Matinkylä was 122 million euros in 0-400 meter radius and 193 million
euros in 0-800 meter radius.
When the impact is totally capitalized to apartment prices, the
annual tax revenues will increase approximately 1,0-1,5 million euros.
Therefore, the capitalized impact to the public revenues from the
increased property taxes is approximately 15-24 million euros in the
studied area. There are eight new subway stations in the city of Espoo.
If the average revenue from each station is somewhere in the same range,
the tax revenues increase ca 120-189 million euros in total. For the
city of Espoo this means that the tax revenues from property taxes
increase for almost 10 percent which a little bit more than what is
found elsewhere. For example in Chile, the building of a new subway line
was estimated to increase property taxes by 7,5 percent (Agostini and
Palmucci 2012, p. 72). On the other hand, Brandt and Maenning (2012, p.
1014) noted that the property tax is not the only tax increasing, also
the transfer taxes increase.
Whether or not the increase in the tax revenue is considered as a
major benefit, the majority of the revenues go to private property
owners. They have the actual possibility to collect the value increase
by selling their properties. It has to be reminded as well that the
increase in value does not happen overnight. The value increase has
probably started several years ago when the first discussions about the
new subway line were started. The benefits are not most probably yet
totally capitalized in the values of the apartments. The long time
period in the value creation makes it difficult to study if the study
material does not include observations from several years.
The methodology utilized in this article does not observe the actual
price changes that the new subway line creates. This study estimates
only the impacts by analyzing the differences of distances. This
methodology is chosen, not because it is the most reliable one but
rather because it is the most suitable one with the material at hand. If
there had been information about apartment prices more widely available,
especially from several years, the methodology could have been altered.
This methodology does not take into account that subway station most
probably have adverse (noice, crimes etc.) effects as well (Brandt &
Maenning 2012).
If the results of this study are compared to previous studies, it can
be observed that the value increase estimated in this study is higher
than in most studies. Most relevant studies that can be compared are the
Finnish ones, in which the average value increase was 1-6 unit percent
lower. This might be explained with the adverse effects that are
excluded in the methodology applied in this study.
6 DISCUSSION AND CONCLUSIONS
The subway is one of the largest investments in the public
infrastructure in the Helsinki metropolitan area. The construction of a
new subway line has an impact on housing prices which is not negligible.
The price tag for a new subway line was approximately 700 million euros.
There has been a wide debate on whether this will be a profitable
investment. A better question would have been, for who is it profitable.
The result of this study showed that the apartment prices increase
122-193 million euros in just one residential area. As there are nine
residential areas where the new subway will have an effect on, it is
undeniable that the investment is profitable. However, most of the
profits are collected by individual property owners and whether this
should be included in the profitability analyses at all, is a political
choice rather than an empirical question.
The construction of a new subway has also a lot of other impacts that
are not in the scope of this study. But in the discussion part the most
important ones cannot be forgotten. First of all, there is a lot of
evidence that public-transit induced premium on sales does not concern
only apartments houses but also other property types, especially office
and retail spaces (Laakso 1986, p. 27; Lahti 1989, p. 66, 97; Debrezion
et al. 2007, p. 161). A new subway also changes the land use near the
subway station to a more efficient one which might have major impacts on
employment. The economic boost that the new subway creates has increased
at least retail and service business near the stations and on the other
hand reduced industrial areas on the neighborhoods. (Bae et al. 2003, p.
92-93). This all fits well to Alonso’s (1968) basic theory on location
and land use.
The reasons why the subway is being built now and not earlier is the
adverse effects that the citizens are afraid of. In some areas of
Helsinki the surroundings of a subway station are not especially
appealing. Will the surroundings change to an undesirable direction is a
question that can only be speculated. The same concerns the public
debate on drug problems that have been added to the list of adverse
effects of a new subway. If the property values increase it does not
seem probable that the surroundings will change for the worse. For us it
does not seem very likely either that the increase in apartment prices
will be used on drugs. One of the interesting implications of the
positive impact of the new subway line on housing prices is the
associated increase in property tax revenues. Our estimations imply a
tax revenue increase ca 10 percent. This could potentially be earmarked
either for the new investments in the subway lines or to the prevention
of the adverse effects that the new subway might cause. Perhaps this
would be the opening in the upcoming debates on whether or not to build
more subway lines in the Helsinki metropolitan area.
REFERENCES
Agostini, C. & Palmucci, G. (2008) The Impact of a New Subway Line on
Property Values in Santiago. National Tax Association, Tax Insitute of
America. Proceedings of the Annual Conference on Taxation. s. 70-75.
ISSN 1066-8608.
Alonso, W. (1968) Location and Land Use: toward a general theory of
land rent. Harvard University Press. 205 p.
Bae, C-H. C., Jun, M-J., Park, H. (2003) The impact of Seoul’s subway
Line 5 on residential property values. Transport Policy. Vol 10:2. s.
85-94. ISSN 0967-070X.
Bowes, D. R. & Ihlanfeldt K. R. (2001) Identifying the Impacts of
Rail Transit Stations on Residential Property Values. Journal of Urban
Economics. Vol 50:1. s. 1-25. ISSN 0094-1190.
Brandt, S. & Maenning, W. (2012) The impact of rail access on
condominium prices in Hamburg. Transportation. Vol 39:5. s. 997-1017.
ISSN 0049-4488.
City of Espoo, City of Helsinki, Ministry of Transport and
Communications. (2002) Länsimetro Ruoholahti-Matinkylä. Tarve- ja
toteuttamiskelpoisuusselvitys. II-vaihe: Metrojärjestelmän ja
bussijärjestelmän vertailu.
Debrezion, G., Pels, E., Rietveld, P. (2007) The Impact of Railway
Stations on Residential and Commercial Property Value: A Meta-analysis.
Journal of Real Estate Finance and Economics. Vol 35:2. s. 161-180. ISSN
0895-5638.
Dewees, D. N. (1976) The Effect of a Subway on Residential Property
Values in Toronto. Journal of Urban Economics. Vol 3:4. s. 357-369. ISSN
0094-1190.
Halvorsen, R., Pollakowski, H. O., (1981). Choice of functional form
for hedonic price equations. Journal of Urban Economics 10, no.1: 37-49.
Hellman, T. (1987) Metro ja kaupunkirakenne. Metro ja maankäytön
muutokset. Helsingin kaupungin kaupunkisuunnitteluvirasto,
Yleiskaavaosasto. Julkaisu YB:5/87. 65 s. + liitt. 7 s. ISBN
951-771-685-0.
Laakso, S. (1986) Metro ja kaupunkirakenne. Helsingin metron vaikutus
asuntojen hintoihin ja toimistotilojen vuokriin. Helsingin kaupungin
kaupunkisuunnitteluvirasto, Yleiskaa-vaosasto. Julkaisu YB:17/86. 35 s.
+ liitt. 27 s. ISBN 951-771-647-8.
Laakso, S. (1991) Metro ja kaupunkirakenne seurantatutkimus.
Helsingin kaupunkisuun-nitteluviraston julkaisuja 1991:6. 64 s. + liitt.
6 s. ISBN 951-772-136-6.
Laakso, S., (1997). Urban housing prices and the demand for housing
characteristics: a study on housing prices and willingness to pay for
housing characteristics and local public goods in Helsinki metropolitan
area, ETLA – The Research Institute of the Finnish Economy.
Lahti, P. (1989) Suurten liikennejärjestelyiden
yhdyskuntarakenteelliset vaikutukset: kolme esimerkkiä. Valtion
teknillinen tutkimuskeskus, Tiedotteita 1023. Espoo: VTT Off-setpaino.
246 s. ISBN 951-38-3511-1.
Lancaster, K. J., (1966). A new approach to consumer theory. Journal
of Political Economy, 74, 1966, pp. 132-57.
Lin, J-J. & Hwang, C-H. (2004) Analysis of property prices before and
after the opening of the Taipei subway system. The Annals of Regional
Science. Vol 38:4. s. 687-704. ISSN 0570-1864.
Malpezzi, S.,( 2003). Hedonic pricing models: a selective and applied
review. Housing Economics: Essays in Honor of Duncan Maclennan, Edited
by K. Gibb and A. O'Sullivan. Blackwell.
McMillen, D. P. & McDonald, J. (2004) Reaction of House Prices to a
New Rapid Transit Line: Chicago’s Midway Line, 1983-1999. Real Estate
Economics. Vol 32:3. s. 463-486. ISSN 1080-8620.
Mills, E. S. (1967) Transportation and patterns of urban development.
An Aggregative Model of Resources Allocation in a Metropolitan area.
American Economic Review. Vol 57:2. ISSN 0002-8282. pp. 197-210.
Muth, R. F. (1970) Cities and Housing: The Spatial Pattern of Urban
Residential Land Use. The University of Chicago Press. ISBN:
0-226-55413-9. 355 p.
Pan, Q. (2013) The impacts of un urban light rail system on
residential property values: a case study of the Houston METRORail
transit line. Transportation Planning and Techno-logy. Vol 36:2. s.
145-169. ISSN 1029-0354.
Rosen, S. (1974). Hedonic prices and implicit markets: product
differentiation in pure competition. Journal of Political Economy, Vol.
82, Issue 1, pp. 34-55.
Sirmans, G. S., Macpherson, D. and Zietz, E. (2005). The Composition
of Hedonic Pricing Models, Journal of Real Estate Literature, Vol. 13
Issue 1, pp. 3-43.
Tuominen, H. (2014). The impact of the West metro on the value of
residential apartments. Master’s thesis. Aalto University School of
Engineering, Department of Real Estate, Planning and Geoinformatics. 64
p.
BIOGRAPHICAL NOTES
Mr. Juhana Hiironen, Doctor of Science (Land
management) 2012, Department of Real Estate, Planning and Geoinformatics
at Aalto University School of Engineering. Dr. Hiironen has made his
Doctoral Dissertation on “On the Impacts and Profitability of Farmland
Consolidation”.
Ms. Kirsikka Niukkanen, Doctor of Science (Land
management) 2014, Department of Real Estate, Planning and Geoinformatics
at Aalto University School of Engineering. Dr. Niukkanen made her
Doctoral Dissertation on “On the Property Rights in Finland – the point
of view of Legal Cadastral Domain Model”.
Ms. Hanna Tuominen, Master of Science (Engineering)
2014, Department of Real Estate, Planning and Geoinformatics at Aalto
University School of Engineering. Ms. Tuominen works as a site manager
construction company (Lemminkäinen Infra Oy) that builds subways among
other things.
CONTACTS
Research Fellow (Dr.Tech)
Aalto University
School of Engineering
Department of Real Estate, Planning and Geoinformatics
P.O. Box 12200
00076 Aalto
FINLAND
Email: juhana.hiironen[at]nls.fi
Web site: http://maa.tkk.fi/en/
Postdoctoral Researcher Kirsikka Riekkinen (Dr.Tech)
Aalto University
School of Engineering
Department of Real Estate, Planning and Geoinformatics
P.O. Box 12200
00076 Aalto
FINLAND
Email: kirsikka.riekkinen[AT]aalto.fi
Web site: http://maa.tkk.fi/en/
Site Manager Hanna Tuominen (M.Sc)
Lemminkäinen Infra Oy
P.O. Box 169
00181 Helsinki
FINLAND
Email: hanna.tuominen[at]lemminkainen.com
Web site:
http://www.lemminkainen.com/Lemminkainen/Company/
|